VolatilityAnalytics.com

  • About the Volatility Analytics Newsletter
  • Contact
  • VIX 101

VXX is Setting Up Beautifully

Posted by Scott Murray on May 5, 2014
Posted in: Uncategorized. Tagged: uvxy, VIX, VXX.

You really can’t ask for much more in VXX. So often the VIX futures sit in a range where they are untradeable, usually when the VIX is in the 14-16 area. In those cases, getting long volatility could eat you alive, yet getting short could get you killed. This is not one of those times.

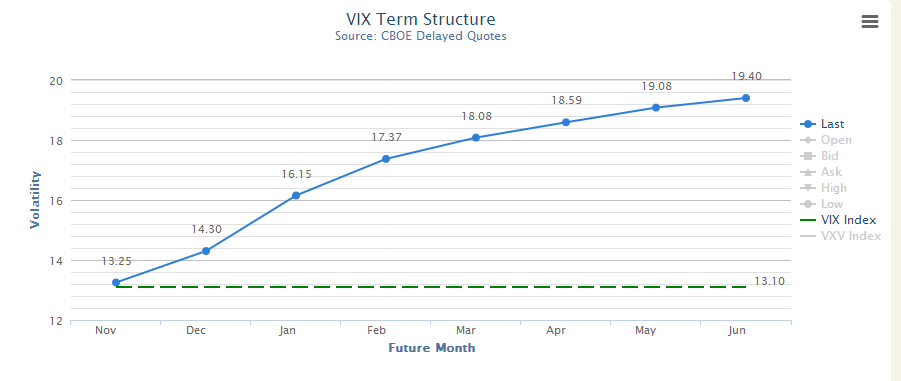
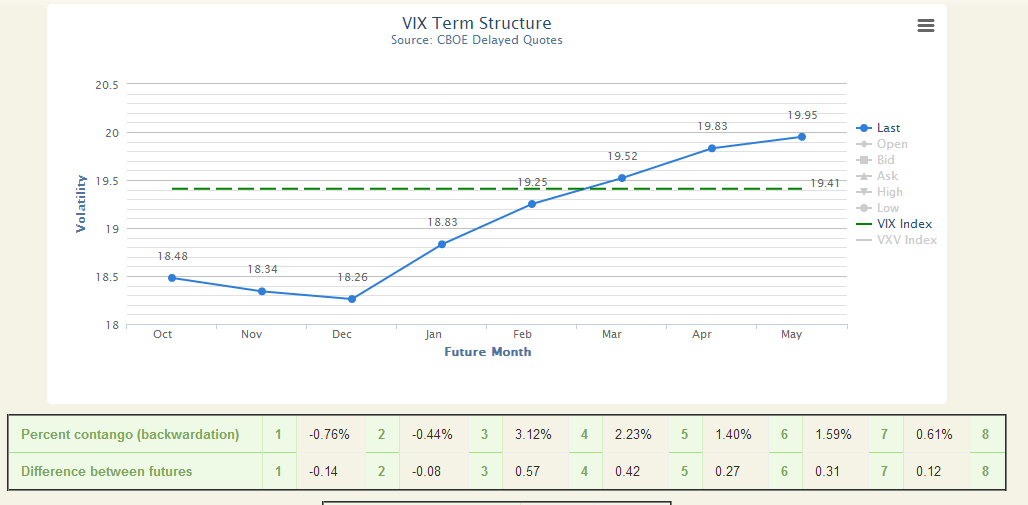
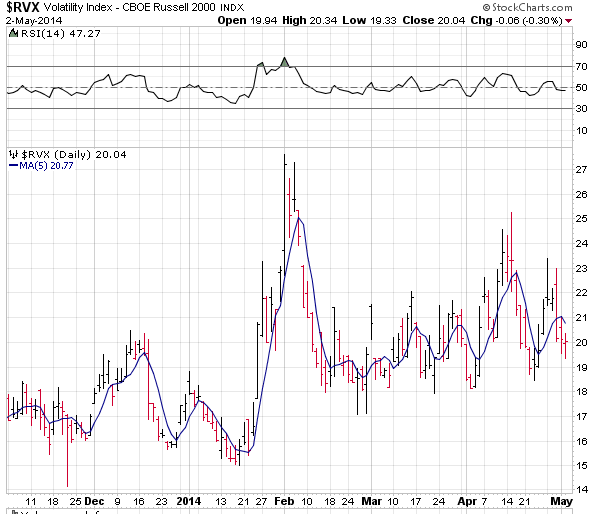
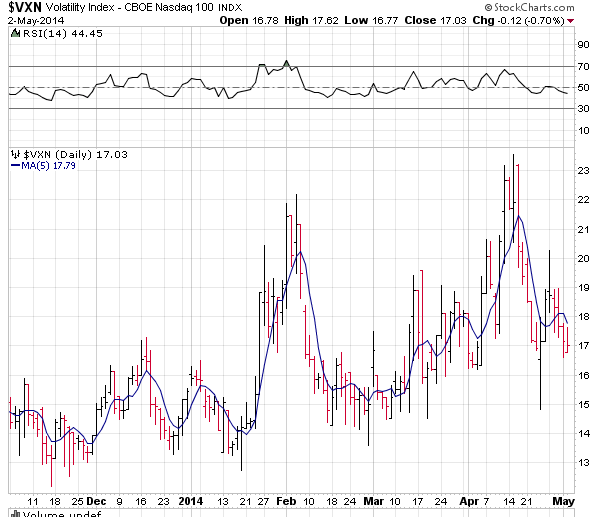
Let’s start with a chart of the front month VIX future this year:

2014-05-05 17_58_03-_VX - Quick Chart Main@thinkorswim [build 1860.10]

There is a flow to these spikes, no? Granted this is only 2014 right here. But go back to last year and the year before that and you will find that this rhythm persisted then too. I don’t ever look at volatility like folks out there on CNBC and stocktwits, trying to get ready for the next crash, that is wasting precious time and money when you can take what the VIX gives you over and over again. Sure, if there is a crash, I’ll be happy to ride that too, but realistically, we deal with the market we have, not the one that we may want.

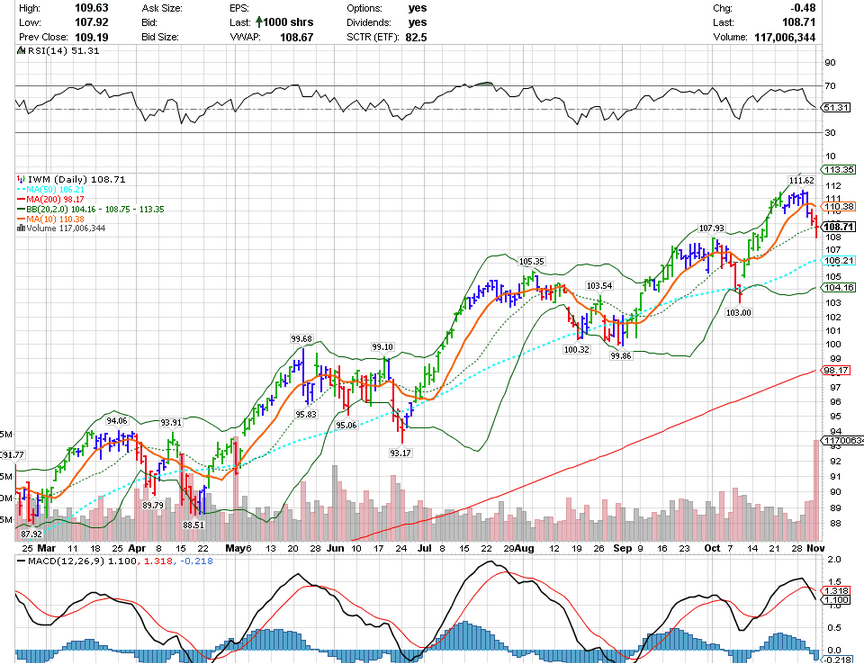
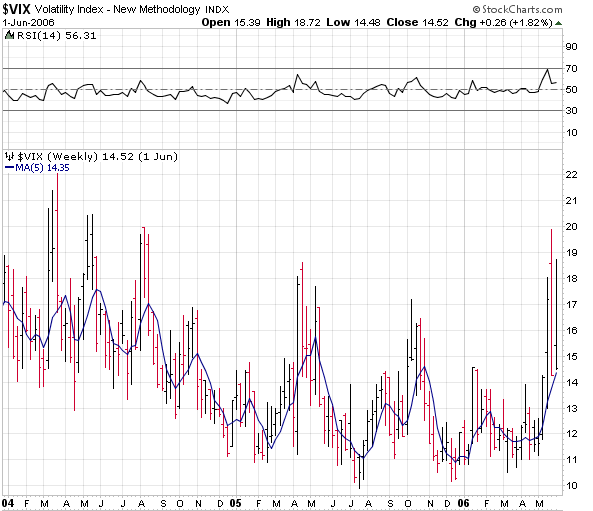
So every 3-6 weeks, you get some sort of rumble, and this is normal and healthy in bull markets. And now that the “sell in May” headlines are fading, it is time to look toward the next rumble. People are feeling better, their tech stocks have stopped cratering, and May is off to a quiet start. Let’s look at how last May went, just for fun:

may2013
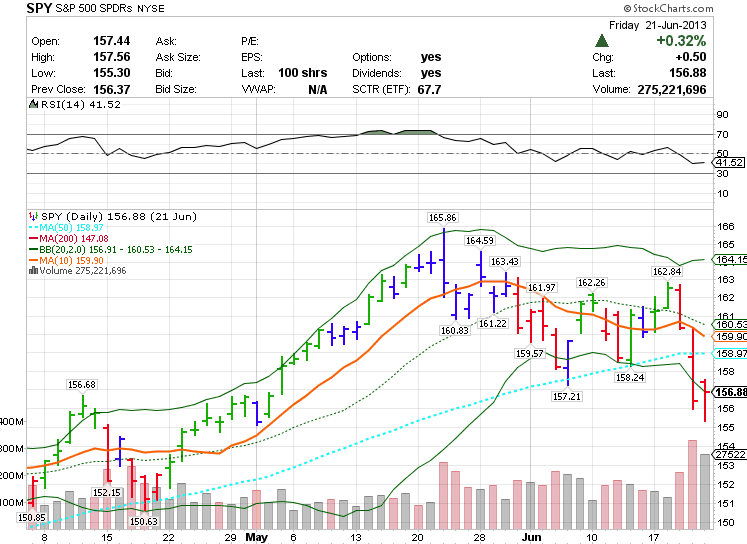
May 3rd featured a better than expected jobs number, and off it went. The last green bar was on options expiration last May and then things got wild. There are correlations to volatility and the option expiration cycle, and there are correlations to volatility and seasonality. I will go into these frequently in the newsletter.

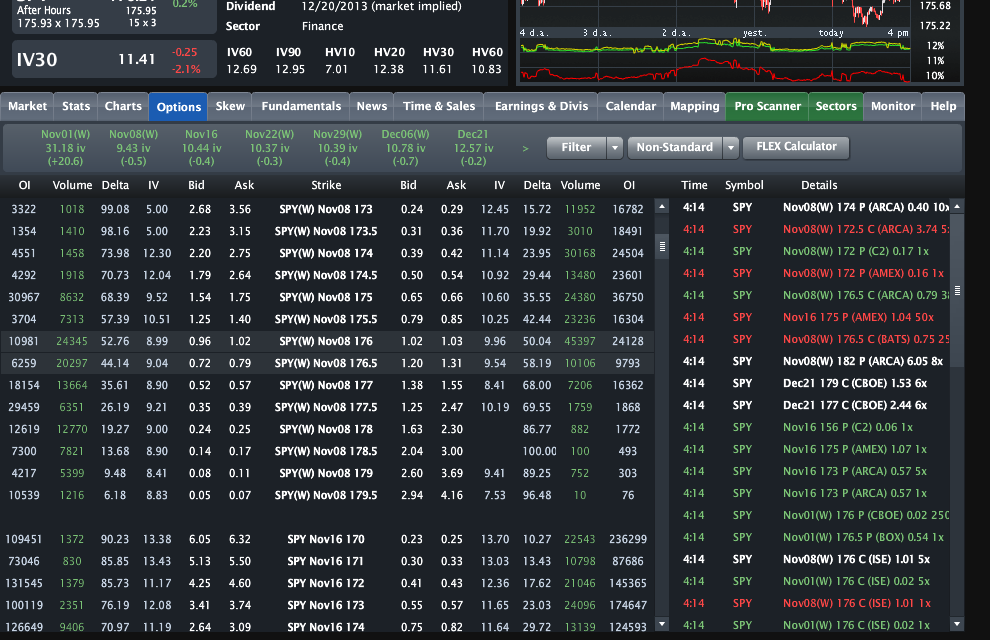
Today I added a few VXX May 30th $38 calls for 2.35. Tomorrow is the day that I was targeting to add more considering the performance of Tuesday in the markets this year. It has been an automatic ramp on Tuesdays, so it may offer some nice prices to get long vol.

(I will be starting a volatility forecasting and signal service shortly for $25/mo if you are interested, and that will also include an email service with real-time trades, and a weekly newsletter breaking down the volatility landscape. There will also be sections with basic option trades and education, ETF analysis for straight trades on volatility, inverse and leveraged funds, and profit loss diagrams. Imagine what you see here and a lot more. Email me at scottmurray1 (at) gmail.com if you are interested.)

VXX and UVXY Present Rare Opportunities-Part 2

Posted by Scott Murray on May 4, 2014
Posted in: Uncategorized. Tagged: uvxy, VIX, VXX.

In part one, we looked at the ranges of different sector VIXs, compared the S&P VIX to a similar past time-frame during a mid-term election cycle, examined the current VIX futures contango structure, and did some rough calculations of negative roll yield in the current structure. Now we want to examine some trade set-ups to take advantage of a low volatility environment.

I want to demonstrate three trade scenarios:

-Put spread sales on VXX and UVXY

-Long VXX calls

-Long VXX diagonal spreads

The main premise of these set-ups is two-fold: A. That volatility can go higher in the next month or two due to seasonal factors, and because volatility is at the low end of the range, thus risk is under-priced. B. That these trades can be set up with an asymmetric risk/reward scenario; that the risk of loss is far less than the potential for gain.

Let’s make a projection of VXX option prices using the negative roll formula:

2014-05-04 20_09_48-Microsoft Excel non-commercial use - crystalballpundittracker

So if you believe the VIX structure will remain in this format, here are some projections for VXX and UVXY prices at future points in time taking into account the negative roll yield. In 5 trading days the VXX will be roughly 39.52, in 10 days 39.03, etc. The UVXY decays twice as fast, relative to its current price.

VXX Put Spreads:

Here is the VXX option chain:

vxxchain-a

One put spread example would be to sell VXX put spreads for next week or the week after at a level that would take into account the negative roll, and gives you some wiggle room for a shift down in the VIX futures of 1 or 2 percent more. For the May 23rd expiration (May5), the VXX 38-37 put spread can be sold for roughly a .25 credit, whereas 15 days of negative roll only get you to $38.55. If the futures curve fell around 2%, that would equate to a VXX price of roughly the $38.55 less another 2% or 37.75.

Thus, it would take not only a significant drop in vol from here for this trade to lose , but there could be no hiccup in the market during this period. If the S&P saw any selling, the VXX simply cannot get to this price. The odds are that you will keep the premium. This same method can be applied to UVXY, at say the $50-48 levels.

VXX Calls:

In the above case, your profit is capped at .25, but it you are bullish on volatility or bearish on the market, it is not a bad time to get long vol using VXX calls. As we described above, there is only so far for the VXX to fall considering how low the futures are, so you can choose some calls that don’t put the entire cost of the calls at risk yet give you a ton of upside if the market sees increasing volatility or sells off:

2014-05-04 20_45_26-Main@thinkorswim [build 1860.10]

Again, knowing that the VXX will have a tough time falling below $38 in 20 trading days, you could purchase the May 30th VXX $37 calls for $3.35 debit. At risk over the next two weeks is realistically around $1.50 of that $3.35, but if the market sells off between now and May 30, the upside could be 100-300% of your real risk of only $1.50 per contract. It would be up to you in two weeks to reevaluate how you see the next two weeks after that playing out, and adjust accordingly, if you hadn’t sold them by that point.

VXX Diagonal Spreads:

This is about as beautiful as option trades get, because you not only take advantage of rapidly decaying premium out-of-the-money, but use that to defray some of the cost of a long volatility position:

vxxchain-c

If you suppose that this week will be a quiet one, but there are storm clouds on the horizon, you could sell the May 9th $41 call for .45  or the $41.5 call for .35 and buy the May 23rd $38 call for around $2.50. Now you are long volatility for no premium paid, essentially $2 which is the current VXX price, less the strike price of the long call, $38. Another advantage of this trade is that you can sell against it again at the end of this week to further cut into your cost of the long call. Also, if volatility rises between now and Friday, diagonal spreads benefit by rising volatility or vega.

So there are three ways to get long vol without paying high premium in VXX or VIX calls. The odds are with you on these trades, whereas buying out-of-the-money calls on the VIX and VXX as many people do is a consistent losing strategy.

I will be starting a volatility forecasting and signal service shortly for $25/mo if you are interested, and that will also include an email service with real-time trades, and a weekly newsletter breaking down the volatility landscape. There will also be sections with basic option trades and education, ETF analysis for straight trades on volatility, inverse and leveraged funds, and profit loss diagrams. Imagine what you see here and a lot more. Email me at scottmurray1 (at) gmail.com if you are interested.

VXX and UVXY Present Rare Opportunities

Posted by Scott Murray on May 2, 2014
Posted in: Uncategorized. Tagged: uvxy, VIX, VXX.

This has been an interesting year in volatility. The past few years have rewarded the most simple of vol strategies, selling vol into U.S. political events and over-hyped European debt crises. (See Cyprus, Portugal, Greece. Greece just came to the bond market last week, and it was SEVEN times oversubscribed at a yield of 4.95%. Apparently their “junk” rating is junk: http://www.bloomberg.com/news/2014-04-22/samaras-sees-greek-bond-yields-falling-more.html)

But now, just as then, a simple strategy can be almost as profitable as long as you exercise patience and know your math in the volatility ETN’s.

Volatility that remains in a firm low range for long periods is not rare, although folks on television frequently harp about the VIX being broken. But let’s be frank, a lot of the CNBC folks do almost zero homework and regurgitate what they hear among each other as fact. The Russell 2k VIX (RVX) and the Nasdaq VIX (VXN) both exceeded 20 recently, a fact you would never hear on CNBC. That is where the volatility was, and the implied volatilities of those indexes reflected that risk.

Russell 2k, Nasdaq 100, and S&P 500 VIXs:

2014-05-02 21_41_47-$RVX - SharpCharts Workbench - StockCharts.com

2014-05-02 21_42_29-$VXN - SharpCharts Workbench - StockCharts.com 2014-05-02 21_42_55-$VIX - SharpCharts Workbench - StockCharts.com

Unfortunately for vol traders/hedgers, Nasdaq VIX and Russell 2000 VIX options were a flop. That also appears to be the case with the VXST, the short-term S&P 500 VIX options. There has yet to be any significant volume in that recently released product. Fact is there are plenty of weekly options available these days in the ETF world for hedging/trading. But, the CBOE does a terrible job of educating anyone in the media about how the VIX works, and therefore no interest or knowledge flows into what could be very useful option products in the VXN and RVX. Especially this year, as you can see in the above charts that the Nasdaq and Russell indexes have entered higher vol ranges.

Anyway, back to plain old S&P VIX, let’s look at a period of time when the VIX held a similar tight range below 18:

Jan 2004 to June 2006:

vix2004-6

And 2012 to today:

vix2012-14a

These are weekly VIX charts covering the same length of time. Not only that, these two charts cover the same time in the presidential cycle, ending in the mid-term election year. They are incredibly similar. In 2004-6, the internet bubble was fading into the distance, and here we are trying to forget about the mortgage crisis.

So vol never goes away, but it hibernates for weeks just to reappear again, albeit in a lower range. So if you have weeks of VIX in the 12-14 range, what can you do? Sell VXX and UVXY put spreads.

First you need to calculate the negative roll in the futures term structure. Here at vixcentral.com, he does it for you:

Courtesy vixcentral.com

2014-05-02 22_38_07-VIX Term Structure

So in the VXX’s case, the calculation is roughly:

.0638 (contango given in the above chart) / 25 (days in this vix roll cycle) x $40 (VXX price) = 10 cents per day of negative roll. This is what the VXX loses on a daily basis at this current structure while rolling from May to June on a daily basis. Now you know what you can roughly expect the VXX to lose over time provided this structure persists. It allows you to project how far the VXX could fall.

Now you need to know how much the VXX is holding of each future, May and June:

2014-05-02 22_45_39-S&P 500 Short Term Futures ETN _ VXX

Almost 50% of each. This is important because the more expensive June future will not rise or fall as fast as the front month. So, if the VXX is heavily back-loaded or front-loaded with a majority of one option, it is far more susceptible to big moves up or down. So right now, it is sort of sluggish, it does not want to move at the same speed as spot VIX. You need to know this, because generally this product moves quickest at the beginning and end of VIX cycles.

Ok, we’ve laid the groundwork for the trades. Next post this weekend I will show some option chains and build some trade structures.


VIX Backwardates Slightly on Mild Pullback – VXX Trades

Posted by Scott Murray on March 16, 2014
Posted in: Uncategorized. Tagged: uvxy, VIX, VXX.

With the market finally showing some weakness after an unrelenting move higher over the last six weeks, the VIX has come off the 13 handle to almost 18. None of this is out of the ordinary, although the financial media acts like the world is falling every time the market takes any kind of a break. There always must be an explanation for a down day, and if they didn’t have Crimea or China to fall back on, they would find some rumor or bring out the bearish punditry to babble about fiat currencies or 1929 chart similarities. There is more BS and misinformation on CNBC than anywhere else unless you watch Fox News.

These pullbacks are opportunities to sell some vol, and there are plenty of ways to do that. First, the VIX curve provided buy vixcentral.com:

2014-03-16 17_05_00-VIX Term Structure

You can see the backwardation in the front of the curve and how the entire curve shifted higher over the past week. The VIX March future expires next week, so it will be in lockstep with the VIX at this point. The implied vol on the VIX options expiring Tuesday is through the roof:

2014-03-16 17_08_31-Main@thinkorswim [build 1856.11]

If you think things will not escalate in the next two days, or that there was a risk premium in the Crimean vote, then you can sell VIX call spreads that expire Tuesday and settle Wednesday morning. 19-21 would net around .25, and 18-20 would net around .50.

Another way to sell vol without having to look at you computer every 5 seconds, would be to sell VXX spreads out to March 28th or later. It is holding virtually all April futures right now, and that will be the front month come Wednesday morning. Here is the chain for March 28th, which is a bit off due to the weekend quoting being less than accurate:

2014-03-16 17_25_10-Main@thinkorswim [build 1856.11]

The 48-49 spread can be sold for about .30, and you have two weeks for things to calm down only slightly. If the market sells off to 1800 or below, than you can expect the VIX to approach 20 and the VXX can certainly rise 10-15%, sending the VXX to the 52 area. But even that will not last for very long as the faster the market falls, the faster it gets to real support. (Permabears can ignore that sentence, since we all know you think the SPX is going to 1000.) The key will be to roll this spread out before it’s too late and it widens. But if the VXX were to head to 52, I would be selling April 4 or 11 spreads over 55.

Other options of selling vol include selling put spreads on the ETF’s with elevated vol like IWM, FAS and TNA. You can get almost .50 for an 86/84 Mar 28th FAS put spread. You can also sell SPY put diagonals, taking advantage of heightened vol in the nearer options.

On April 10th, the VXST, or short-term 9-day rolling VIX based on SPX option volatility will give vol traders the ability to trade short term vol in an more efficient way than trading the monthly VIX options. I will discuss that more as we get closer to that date.

VXX 101 – Why it Doesn’t Move On Days Like Today

Posted by Scott Murray on March 11, 2014
Posted in: Uncategorized. Tagged: tvix, uvxy, VIX, VXX.

There hasn’t been much volatility to speak of, but that could change, especially as we get closer to May and June. As the market’s best season (November-April) is nearing an end, I decided to get back to posting once or twice a week, and more frequently if we experience higher vol levels. There really hasn’t been much to write about this year, frankly, without any political nonsense, taper panic, or Eurozone defaults. Kind of boring, right?

Today I want to go over the VXX structure again, since I endlessly see tweets from folks that are completely baffled by why the VXX doesn’t rise when the VIX rises or the market falls. These events are not mutually inclusive. The VIX can fall in a falling market, and frequently does after market events, like a highly feared/anticipated Fed meeting. Let’s look at the current VXX structure again for starters:

2014-03-11 20_23_19-S&P 500 Short Term Futures ETN _ VXX

After today, the VXX can only hold 25% of March futures, because it is only being traded for 5 more days. The VXX Pokies rolls every day. So the driver of the VXX is now the April future. Here is what the futures curve looks like:

2014-03-11 20_46_55-VIX Term Structure

The April VIX future barely moved today as you can see here:

2014-03-11 20_49_48-_VXJ4 - Quick Chart Main@thinkorswim [build 1856.8]

So there you have it. The April future moved up a measly 1%, and so did the VXX. Now, if the market really cared about the sell-off today, the VIX would have broken 15 to the upside. Without any conviction from those buying S&P puts (the basis for the VIX calculation), then the futures market is not going to take notice, and still has a considerable buffer of 1.2 built in: VIX future of 16.05 less VIX of 14.80. There is no fear or protection being demanded at the moment.

From an options perspective, there isn’t much to do in the VXX or UVXY. The future being 16 is too low to sell VXX calls and too high to sell VXX puts. We will sit and wait for a spike or a dip to get busy.

Volatility ETFs Ripe for a Holiday Trade – VXX and UVXY Roll About to Get Heavy

Posted by Scott Murray on November 18, 2013
Posted in: Uncategorized. Tagged: uvxy, VXX.

The VXX and UVXY are about to hold entirely the Dec contract and start rolling into Jan. The curve is quite steep:

vixterm1118

vixfut1118

On Wednesday morning, the VXX and UVXY will be selling each day 1/20th of their holdings in Dec and buying Jan. Right now, that presents a nice opportunity to be short these funds, for multiple reasons. First, the VIX tends to make an annual low in December. That is a 12.5% roll over the next 20 days at today’s prices. (16.15 – 14.31 = 1.84. 1.84 / 14.31 = .128 or 12.8%)

That divided by 20 days is .64% per day for the VXX or 1.28% per day for the UVXY. That is about 30 cents for each ETF roughly per day of negative roll yield. All things being equal, if the Dec and Jan contracts stay at their current prices, this will be subtracted from the ETFs’ indicative value, or their NAV.

You also get the bonus of Thanksgiving decay, one free day of roll without the market being open next week. So it really has to roll up in 19 days. This is a huge headwind.

What can you do to take advantage of this? Sell call spreads in both, so that your risk is capped in case there is a major market sell-off due to an unforeseen event.

Looking at the LiveVol option chain for UVXY:

uvxychain1118

If you anticipate that the UVXY will be less than 20 using the metrics above on the day after Thanksgiving, you can sell the $20-22 call spread for approximately .80. Your max risk is $2, but there is a ton of roll between now and then, and Thanksgiving week has a very bullish bias in the stock market.

You can do the same in the VXX, say at $47-49 for .60 or the $46-48 for .80 approximately. All you need for these to work is a flat market, so that the roll can do its job. If the market goes higher, the UVXY and VXX will get hit even harder as the Dec futures head lower.

Will Volatility/VIX Make a Return this Month?

Posted by Scott Murray on November 1, 2013
Posted in: Uncategorized. Tagged: VIX, Volatility.

There has been no volatility to speak of lately, so the posts here have been thin. While my focus therefore has been on specific name volatility arbitrage, (calendar IV spreads) there are hints that volatility may rise in the month ahead. Let’s examine why.

First let’s look at the S&P, NDX, and RUT charts (using SPY, QQQ, and IWM for volume profiling):

spy111 qqq111 iwm111

All three charts are very bearish, with MACDs rolling or crossing on every one. As you can see, MACD does not immediately turn around and head back higher until it resolves itself. It almost always leads to lower prices. Because uptrends do not reverse on a dime generally, (blow-offs aside) you get some chop at the top. That is what we are doing right now. But the canary in the coal mine may be the Russell 2000. It’s already only 2% above the 50 day after giving up 3% this week alone. Unlike the other indexes, it does not respect the 50 MA that much, unlike the S&P 500, which everyone watches like a hawk when it nears the 50.

The VIX during this chop is still dormant. While the media tone has slightly changed from “QE forever” to “QE taper in Jan, maybe”, folks are still not bidding up put options. They have reason to be complacent, November is a great month for stocks historically, #3, and when followed by great Seps and Octs, the chase usually is on to Dec 31st. But you more need buying, and there has been a ton of inflow lately to equity markets. The VIX may be lurking though, for at least an uptick:

vix111When the VIX sits down here, it takes 4-6 weeks generally for it to make an inevitable move higher. At least a move off of the 12-13 level. The good thing about the VIX being so low, is that you don’t have to pay much if you like downside options, anticipating a natural consolidation in stocks. One thing that works pretty well in this scenario are diagonal spreads. Let’s look at one example of how to get your risk/reward in asymmetrical shape.

spyiv111

This is the option ladder via the fantastic LiveVol platform. I like diagonal calendar spreads in this scenario. You would sell a nearer term put at one strike and buy another longer dated put at a lower strike, thereby lowering your cost and giving you the opportunity to make multiples on a market slide. One potential trade would be to sell the SPY $174 Nov 8 put for .40 cents and buy the Nov 15 $173 put for .56, for a net debit of .16. If the SPY stays flat or falls over the next two weeks, this trade will work and could be a big winner.

A rise in volatility will also juice the longer dated put as well. It is very hard to lose significantly on this trade. If the market stays right here next week, without even falling this trade will probably make 50%. If it falls to 174 next Friday, then you are looking at a 5x or more return, as the ATM puts for next week are worth around $1. That is without adding any vega to the put value.

Expect more posts in the coming week with vol trade set-ups.

Volatility is Alive, Even if the VIX is Dead for Now

Posted by Scott Murray on October 21, 2013
Posted in: Uncategorized.

It is entirely possible that the VIX and general market volatility remain subdued for the rest of the year. With so many managers underperforming the indexes, and lots of gold and bond money floating around, there could be a constant bid for stocks heading into year end. This is before any POMO consideration, which I think is over-rated in effectiveness, but has powerful psychological market implications.

I’m not predicting market direction, just surmising that there could be a line of folks looking for an entry, so pullbacks could be small. Thus, the VIX will not respect a falling market until it demonstrates an ability to violate widely watched levels, like the infamous 50 day moving average.

What to do for vol traders? Quite simply, there are always vol opportunities when you consider earnings and event driven trades. Short-term options reflect the potential for big moves, while the longer-term options reflect less volatility. Interestingly, for true vol fans, this concept is discussed by Jamie Mai in Hedge Fund Wizards, one of Jack Schwager’s great interview-style books. Jamie discusses why it is counter-intuitive that longer vol should be lower than short-term vol when the potential for major unknown event risk sits between the short options and the long options. Check it out for some fascinating reading.

A terrific platform for Online Pokies vol trading is LiveVol, and I have had the privilege of giving it a test drive over the last couple weeks. Vol traders will absolutely love this, it is built specifically for them. And earnings season is perfect for a platform build for setting up vol specific trades.

Let’s look at a specific example using NFLX:

lvnflx1021

The weekly implied volatility (circled) is 80 points higher than the January calls. This is an excellent opportunity to sell one against the other. When earnings are revealed, the short term IV will implode, while the long-term will fall at a much lower rate.

This is the trade I put on this morning:

Short NFLX weekly $380 for $7.26

Long NFLX Jan 2014 $380 for $17.81

Net debit $10.55

This was set around 10% out of the money when I put it on, and NFLX rose by 5% during the day and 9% after hours. I specifically set the short call 10% out of the money, as I felt I was getting a good value provided by short-term earnings traders. This trade had only about 50% of overnight downside, but has unlimited return potential.

AMZN, FB, and countless other weekly options provide this opportunity. So while the VIX is low, selling vol is still easy to do on an asymmetric risk/reward basis.

VIX Rises to Four Month High – VXX Now Rolling Positively as Backwardation Steepens

Posted by Scott Murray on October 7, 2013
Posted in: Uncategorized. Tagged: VIX, VXX.

These are the times you should look forward to. People are starting to spend serious money on out of the money puts and pumping up the VIX. The low delta puts are catching a strong bid, and this is what gets the VIX surging. It has been a while since we’ve seen this, and it could go much higher. First, let’s look at the VIX weekly chart to get some perspective:

vix107

Realistically, we are not that high, in fact we are about average for an October VIX. Looking at past mini-crises in recent years, the VIX has been much higher. The last debt ceiling debacle saw a VIX of nearly 50. As recently as last December it was 23. So 19 is not that high, and this chart demonstrates that.

We have not had a real correction for over two years, so there are a lot of folks out there that have had nothing to fear for a long time. Add to that the consensus opinion that the government will come to a deal on Oct. 17th, and you have a recipe for a surprise. I’m not expecting a cataclysmic event either, but you must keep in mind what could go wrong.

This demonstrates how heavily bid the OTM puts were. Look at the low deltas as a percentage of put purchases on the SPY:

spyvol107

When the spot VIX and futures are in backwardation, the curve inverts and it is a cause to be wary. If you are short VIX futures for Oct, you should be sweating because the Oct future will get closer to spot as we approach the 15th, and that could be the height of concern:

vixterm107

Courtesy: Vixcentral.com

This structure means that the VXX and UVXY are adding value as they roll into November, by purchasing cheaper futures (NOV) and selling more expensive ones (OCT). This is positive roll and for the VXX and UVXY it is rare. But this situation can certainly imply more equity market pain.

I’m getting itchy to sell vol, but it is not the time, because we are nowhere near a resolution, and a lot of index charts are implying more downside. The S&P broke the 50 SMA today, and the Russell 2k just gave a MACD cross lower sell signal. I’m literally sitting on my hands right here, but should there be a break in the logjam (doubtful this week, IMO), then I will be ready to act.


VIX Almost Touches 19 Intraday – Huge VIX Trade Setting Up

Posted by Scott Murray on October 3, 2013
Posted in: Uncategorized. Tagged: uvxy, VIX, VXX.

This will be the trade that makes your Christmas a nice one, and it is very basic. I will have more to say about this next week, but suffice it to say, I will be shorting the UVXY soon, and I will never cover the position, essentially evading capital gains tax. More to come. Meanwhile, the VIX curve has flattened out in a way that has been rare this year:

vixcurve

Courtesy: vixcentral.com

The VIX finally came alive, as the market really cascaded through obvious support levels on heavy volume. This is still not the time to sell vol unless you are very nimble. There will be plenty of time to sell it after the event risk ends and the volatility exhale commences.

I warned readers to be wary of selling vol recently, and those that ignored that are feeling some pain. Patience is key in finding the entry point. If you have to be early, save some selling power for a real scare. We may have two weeks to go before the optimal entry point presents itself.

Stay tuned. These are the opportunities you wait months for.

Posts navigation

← Older Entries
Newer Entries →
  • Subscribe to the VA Newsletter – $30/mo

  • Follow us on Twitter

    Follow @VolatilityWiz
  • RSS Volatility Analytics RSS Feed

    • Summer Volatility – Will it Vanish?
  • Recent Posts

    • Summer Volatility – Will it Vanish?
    • Creative Volatility Trading (Part 1) – Calendar Ratio Spreads
    • Trading Volatility in a Low Vol Market
    • How Much Short-Term Downside is Left in VXX and UVXY?
    • Volatility Analytics Newsletter Returns
  • Archives

    • May 2018
    • May 2017
    • April 2017
    • November 2015
    • August 2014
    • May 2014
    • March 2014
    • November 2013
    • October 2013
    • September 2013
    • August 2013
    • July 2013
    • June 2013
    • May 2013
    • April 2013
    • March 2013
    • February 2013
    • January 2013
    • December 2012
    • November 2012
  • RSS VIX and More Blog

    • Looking at Coronavirus Cases per Million, by Country
    • Tracking the Trajectory and Peak of Coronavirus Cases
    • Euro Zone VSTOXX ETNs Land on U.S. Beaches!
  • Categories

    • Uncategorized
Proudly powered by WordPress Theme: Parament by Automattic.