Short volatility strategies proliferate; Volmageddon II nearing? – Long calls/short puts market flips dealer assumptions and market behavior – Trade for cpi/fed
Volatility Summary
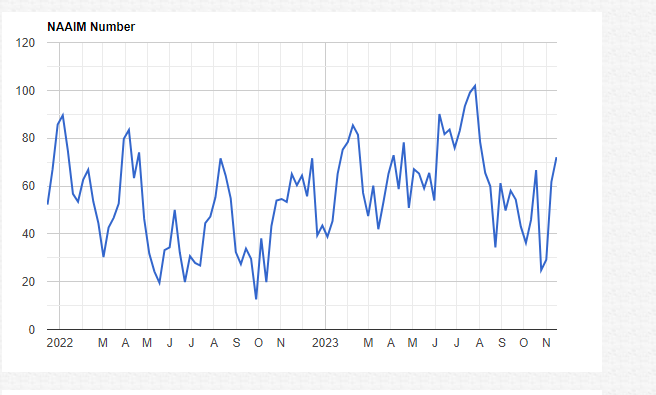
Now that everyone is done their buying now and paying later, we can discuss the short vol now and worry later cohort. Or maybe they don’t worry at all, convinced that a slew of Fed cuts are on the way next year:
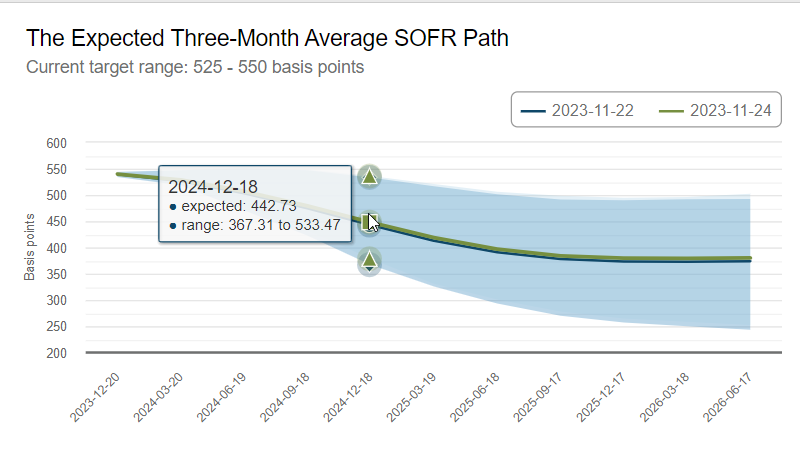
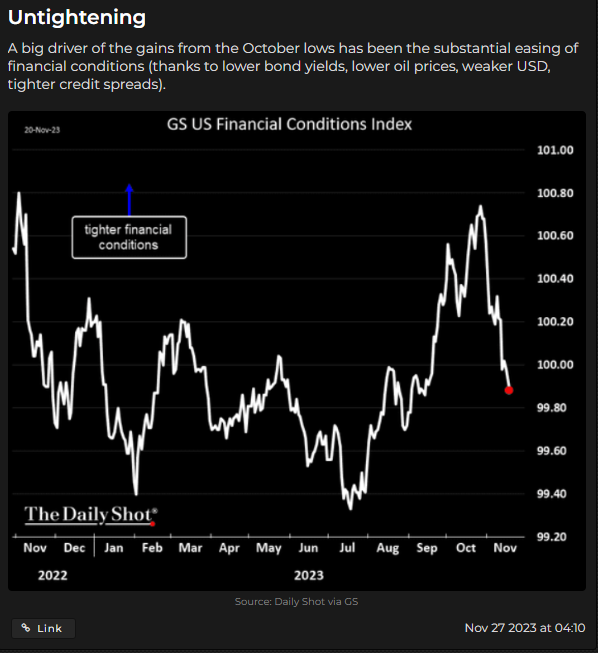
That is basically four cuts in the market, and with the ten year treasury rate nosediving lately (all that nonsense about tailing auctions, now as forgotten as a bad joke) financial conditions have eased markedly, which might bring back the ole hamster wheel of Jay talking tough again, which he will have an opportunity to do on Friday and obviously during the next Fed podium show open mic during quarterly opex week:
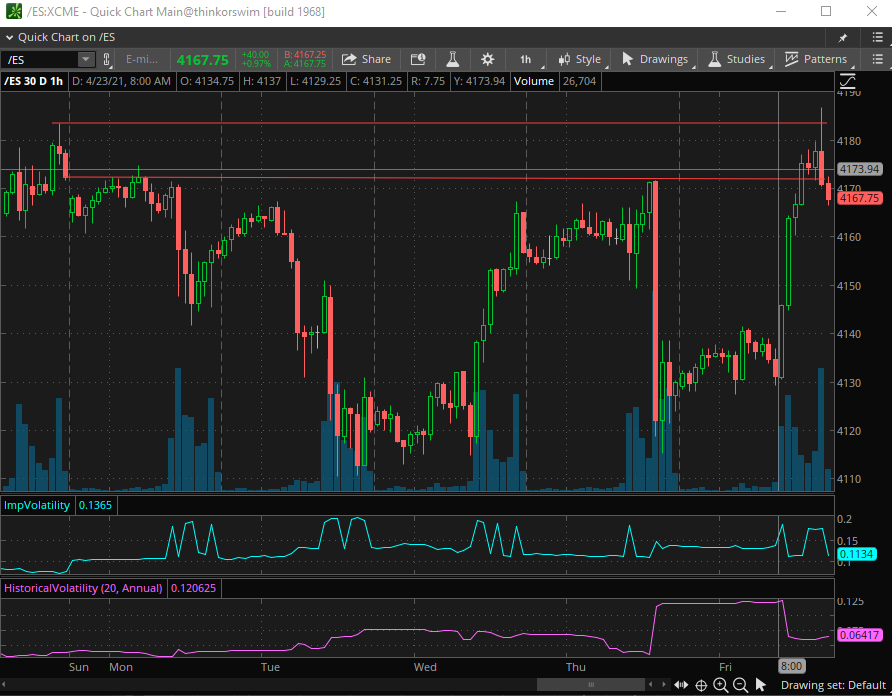
Although today was a bit of a blast from the past with the 7-year auction not going well, dealers forced to take a huge chunk and it tailing the market yield pre-auction:

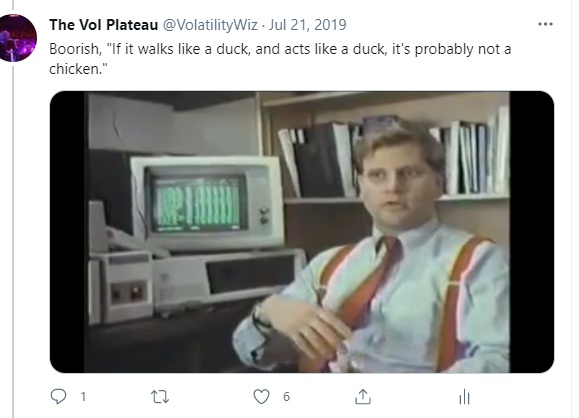
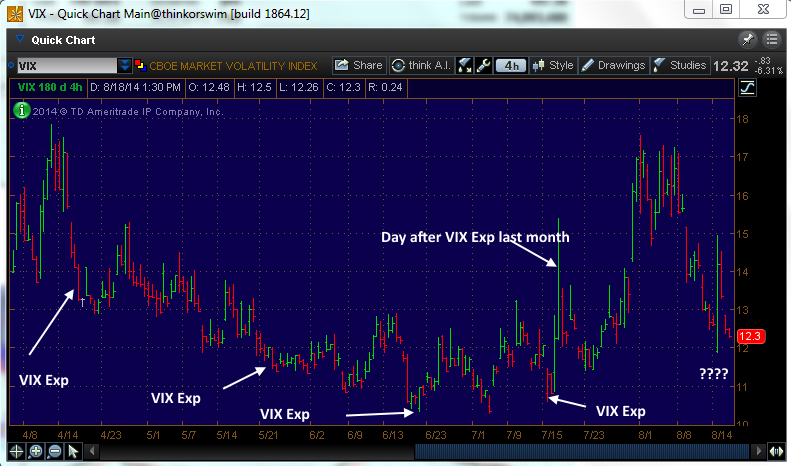
And, if you are one of those that think the VIX is broken, well, this is how it acted on the auction results:
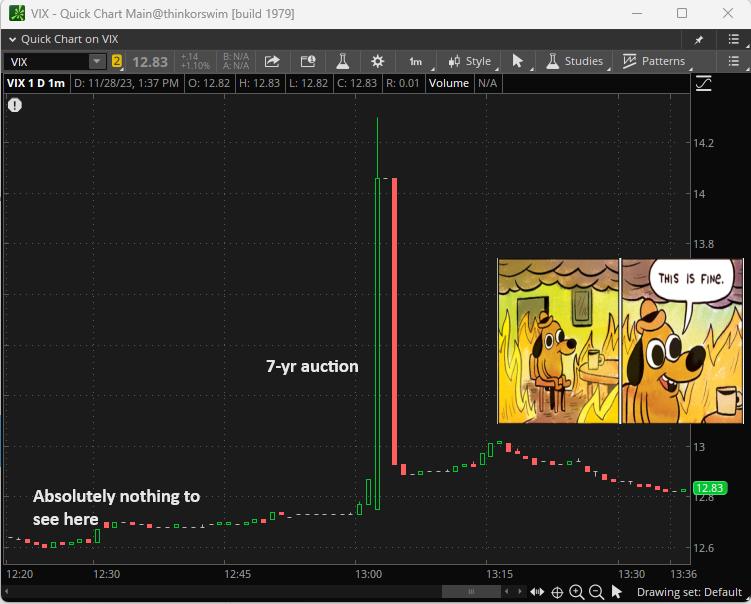
The important auctions are coming during Fed week, 10 and 30 year.
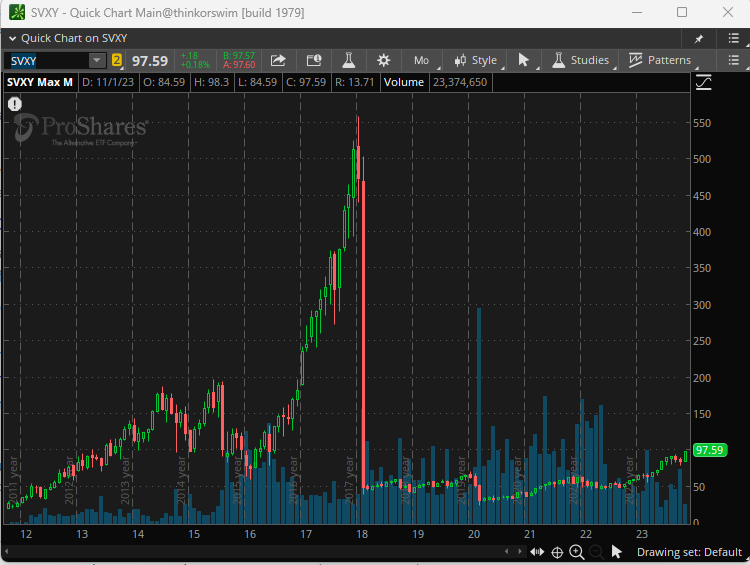
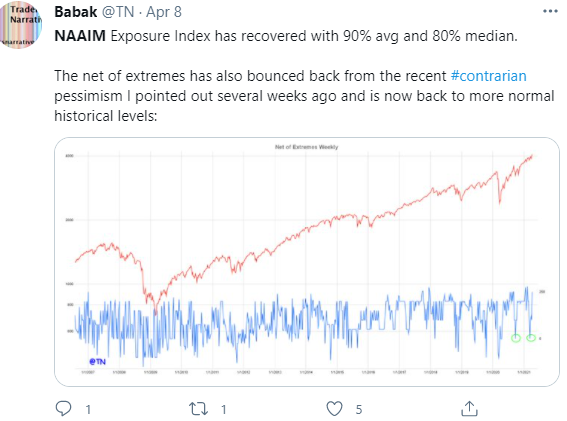
This kind of thing reminds me of volmageddon 2018, when shorting vol got absolutely out of hand. It was concentrated in the short volatility futures ETF space, which died a quick and spectacular death never to be the same. RIP XIV. A castrated SVXY still exists with a .5x inverse governor on it, but this chart will remind you of how it went down:
(For a longer walk down memory lane:
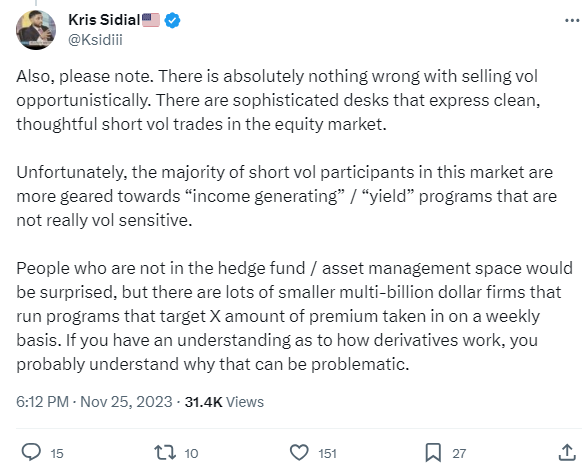
Today, with 0DTE mania and the like, we have a new and growing crowd of vol shorters, and they are diverse. One faction of the short vol mob includes ETFs selling vol for yield, providing regular monthly income, and their assets are soaring. For reference, volmaggedon caused losses in those short vol ETFs of less than $5 billion:

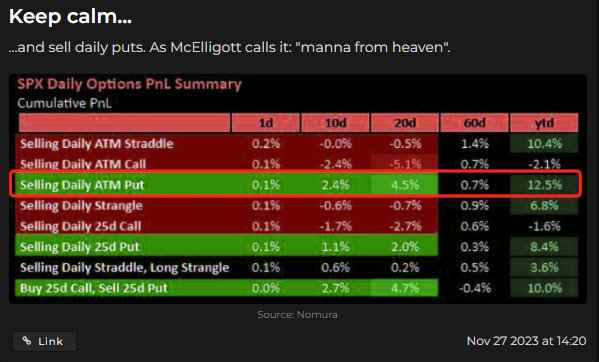
Of course, 0DTE options have seen a surge of daily vol selling, which is why every dip essentially disappears these days. As soon as there is any downside vol, the quant strats come in and set another put wall. They are doing quite well lately, Charlie the celebrity quant calling it manna:
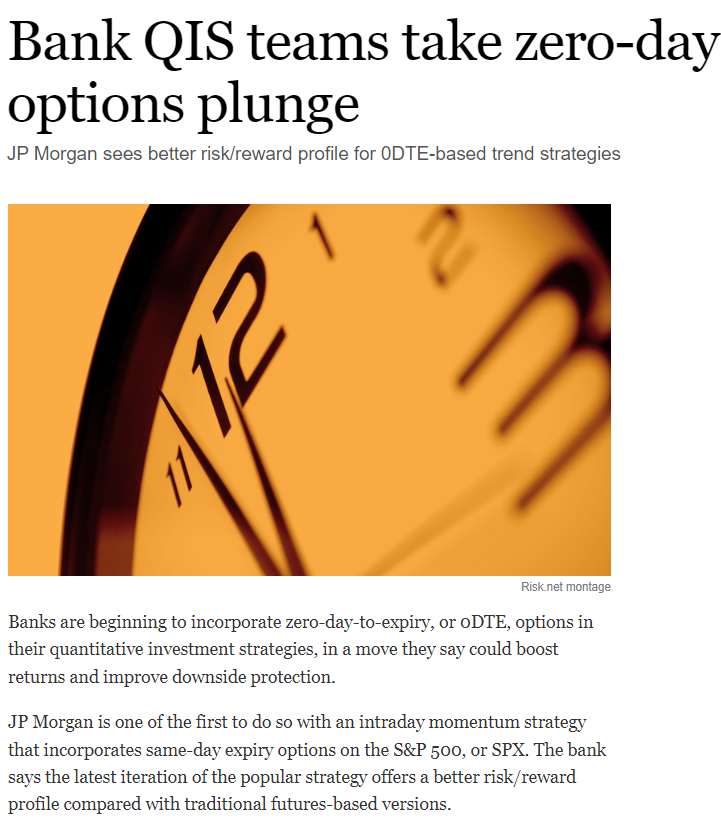
And, risk.net just ran a story demonstrating how bank quant trading teams now see 0DTE vol as attractive:
And of course, the hedge funds:
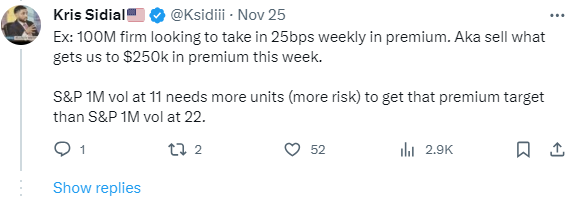
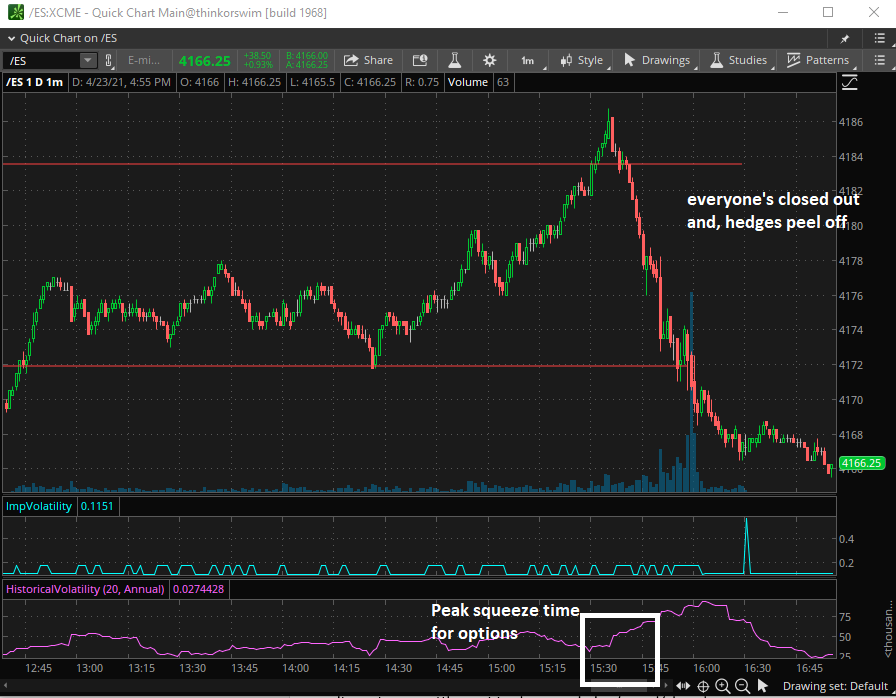
The selling puts to buy calls market is here, it is a ‘stabilizer’ when nothing else is going on. Market drops, puts are sold. Dealers now holding more puts hedge by buying futures. Since we’ve recently discussed the everyone is mega long tech/qqq/spx call dynamic, when dealers are short calls and there is news, you get these intraday spikes up, the result of dealers buying more futures/stocks to cover their short calls.
In essence it’s a reversal of how it used to be and how the dealer reaction function was modeled. It used to be assumed that dealers are primarily long calls sold to them (covered calls perhaps), having these dealers react by selling futures to hedge their long call position and subsequently buying them back on dips or when their calls burn off (charm/delta decay).
Now, dealers are short calls in indices/giga tech and when the market goes up, they have to quickly buy more to hedge upside convexity. (You saw it today, when for no reason the market spiked up on Waller commentary. Bowman said numerous things to the opposite of Waller, but that didn’t matter, the upside spike needed the immediate hedging.)
Also, it was assumed that dealers were short puts, that folks bought as protection for market drops. (Oh, how old timey! Who in their right mind needs to waste money on insurance!) When folks used to buy puts, the dealer sold futures to hedge against a drop/their convex downside exposure to puts sold. Now that selling puts to dealers is the thing to do, dealers are long more puts and thus as the market drops they are buyers of futures:
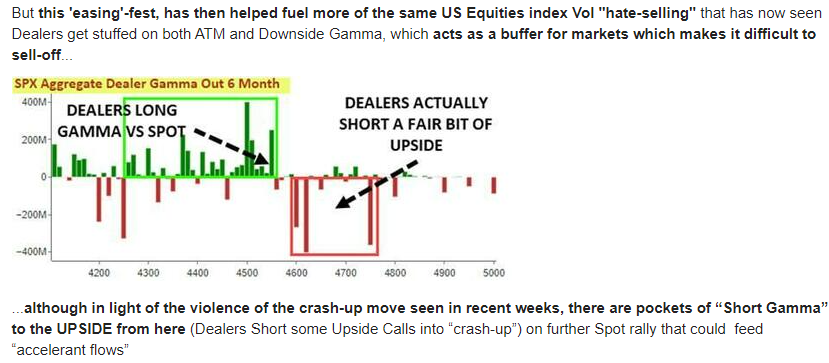
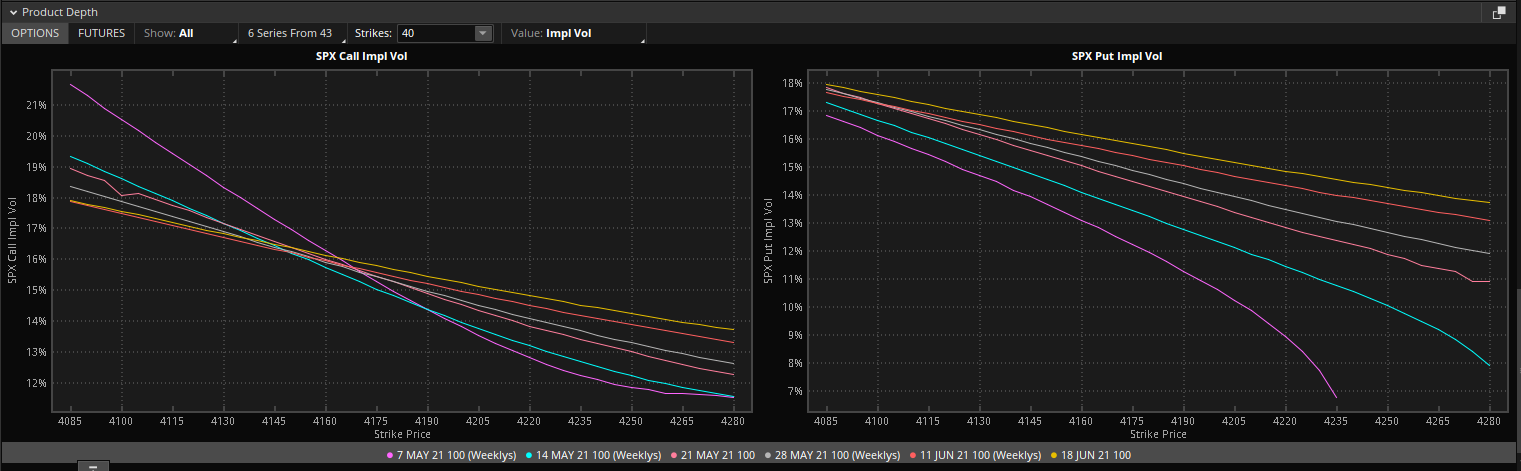
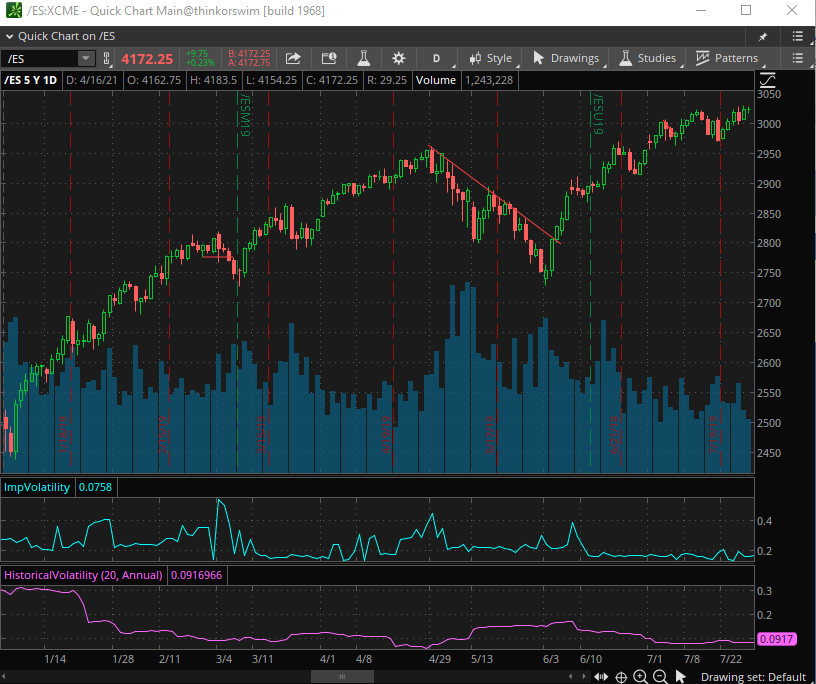
The result of all this quaintly described ‘hate selling’ of vol and risk reversal positioning (selling put vol to buy call vol) is that prices are as cheap as ever to hedge or position for a downside move/swing trade. First, you can see put vol crushed and call vol owned in this chart:

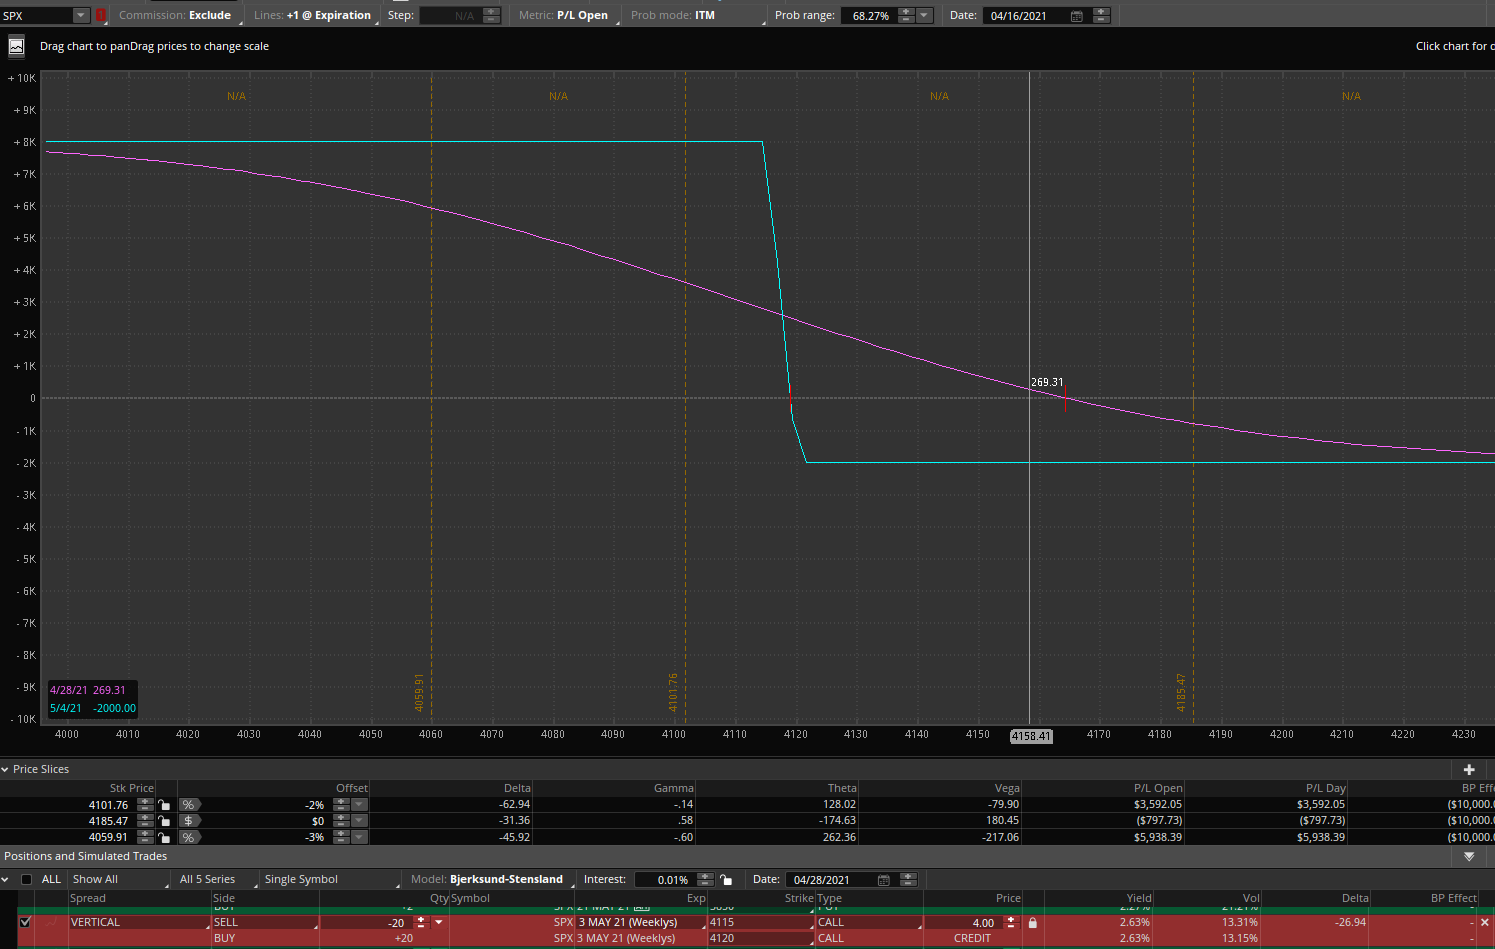
The result being that a put vertical spread to hedge is as cheap as it’s ever been, and that is saying a lot if you remember the pre-Volmageddon days of 10 VIX:
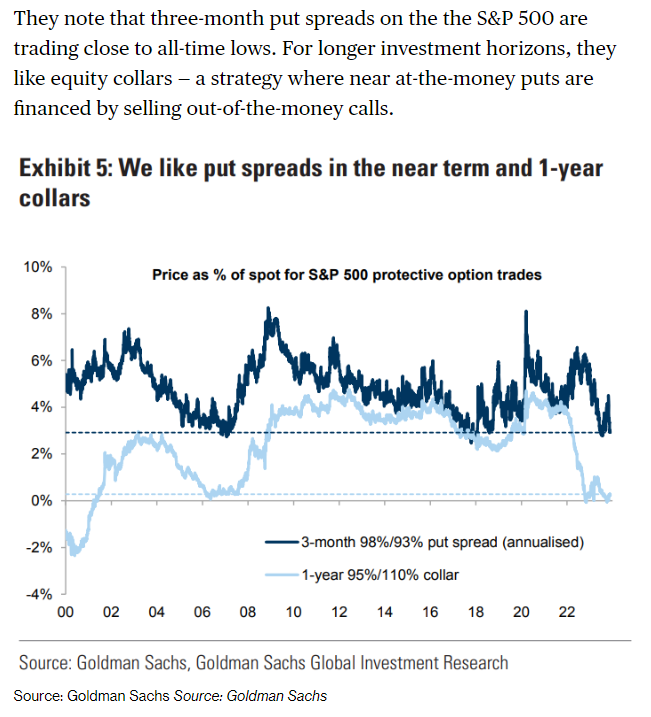
But clearly no one wants hedges, I mean, with everyone crowded in a few stocks that are wickedly overvalued, over-owned and at all-time highs? Fuhgeddaboudit:

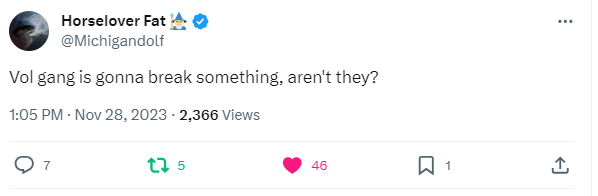
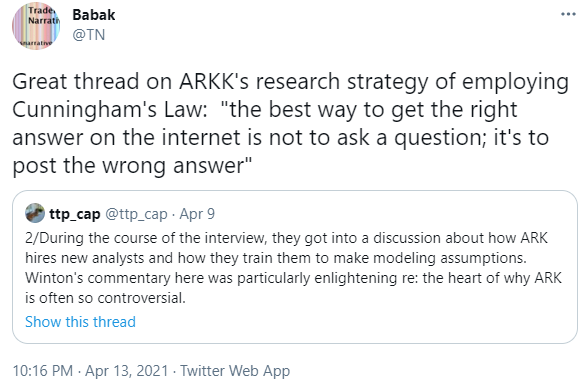
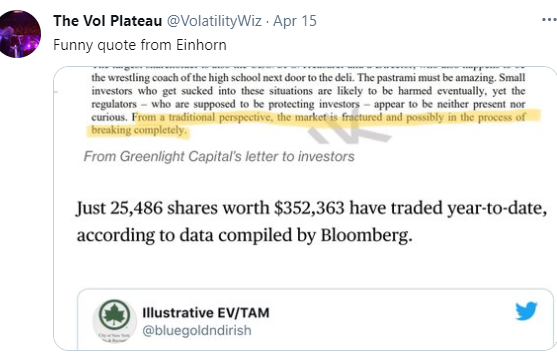
Folks are taking notice of all this short vol. They know what can happen:
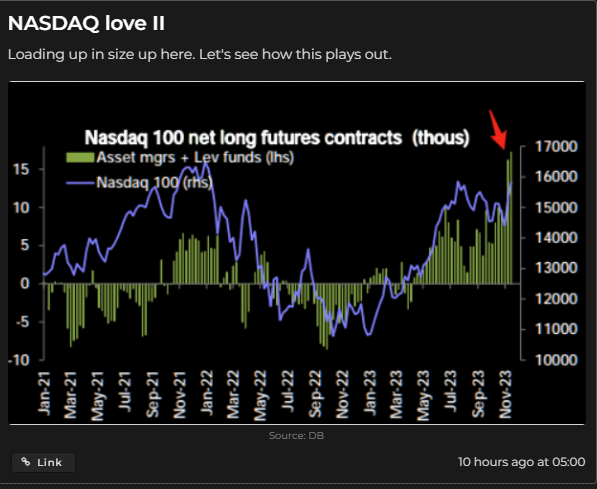
So, now we enter December, or the second half of the market’s end-of-year game of chicken. The first part in October saw a lot of hedge funds degross and puke out some giga tech longs, which they obviously just herded back into with amazing speed and in more concentration than before if you can believe that! Believe it:
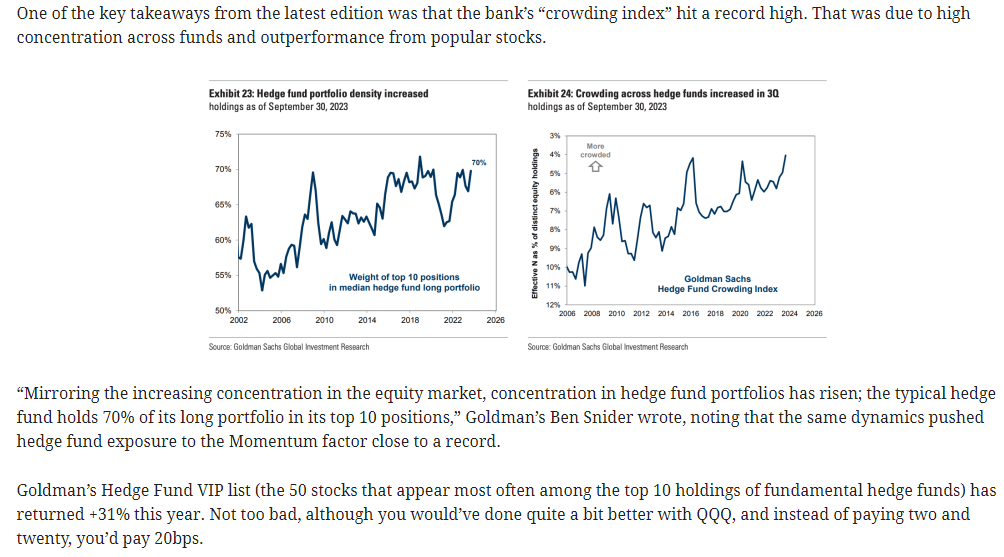
Source: https://heisenbergreport.com/2023/11/22/hedge-fund-crowding-hits-record-amid-mega-cap-rally/

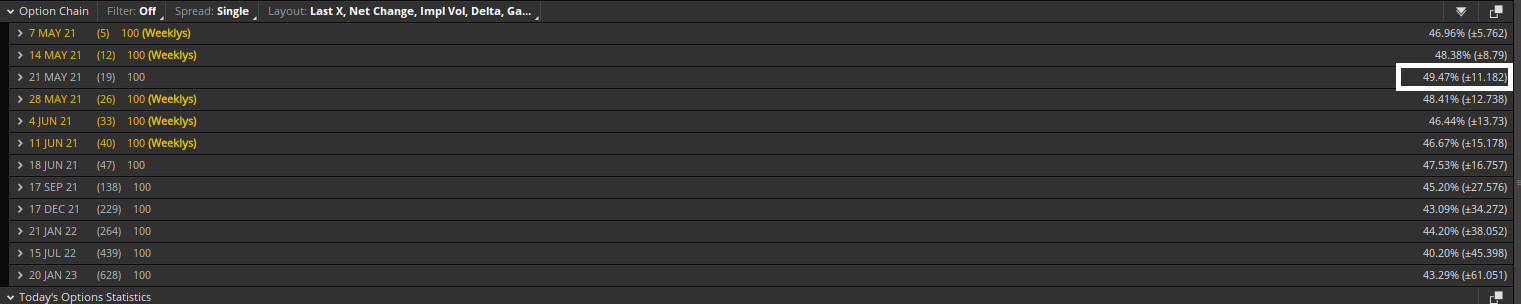
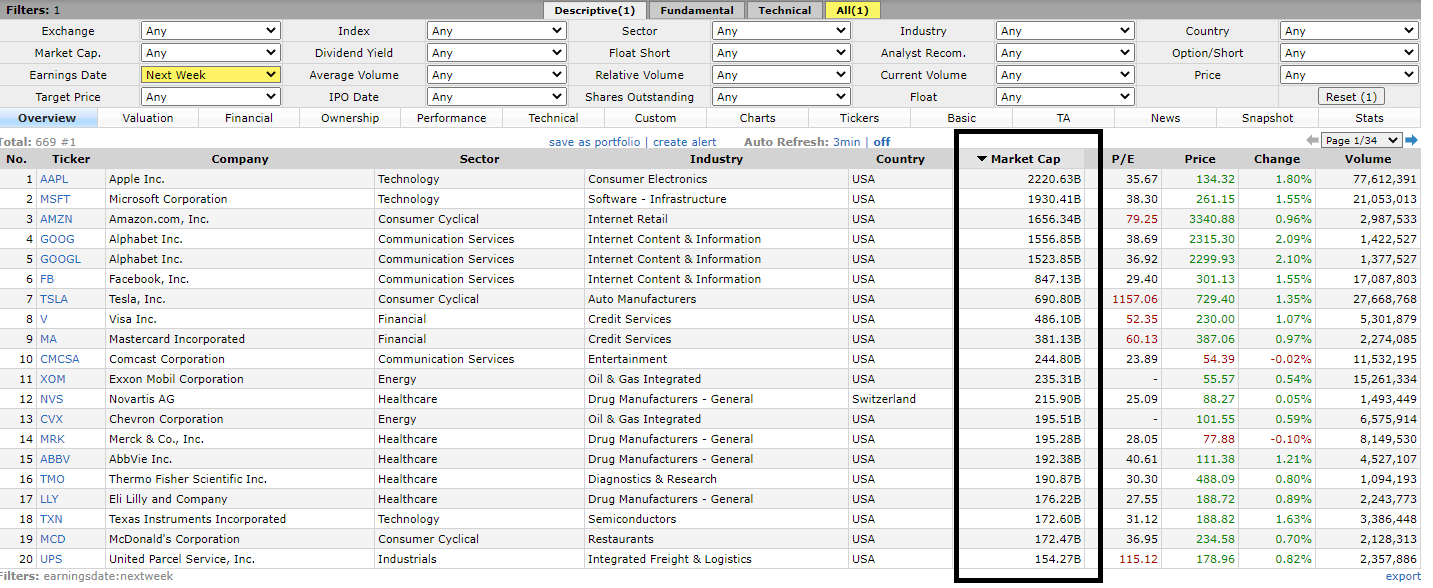
Does this scream 12 VIX to you? 30-day forward vol includes, and I’m sure I’ll miss a few:
-Treasury auctions 10s/30s – you just saw the 7-yr break the VIX for 15 minutes
-Fed meeting with SEP/Dot plot
-Quarterly OPEX
-JOLTS- one of the biggest market movers this year, if you can believe it
-Non-farm payrolls
So, while we may be propped here for now with short vol dominating/wagging the indices dogs, it certainly appears that December is going see more volatility the deeper we get into it. Simply the major expiration combined with all these vol events is enough, and with so many folks short vol, a pre-Santa surprise might be in store for managers itching to send out those statements stuffed with giga tech marked to perfection.
Volatility Trades:
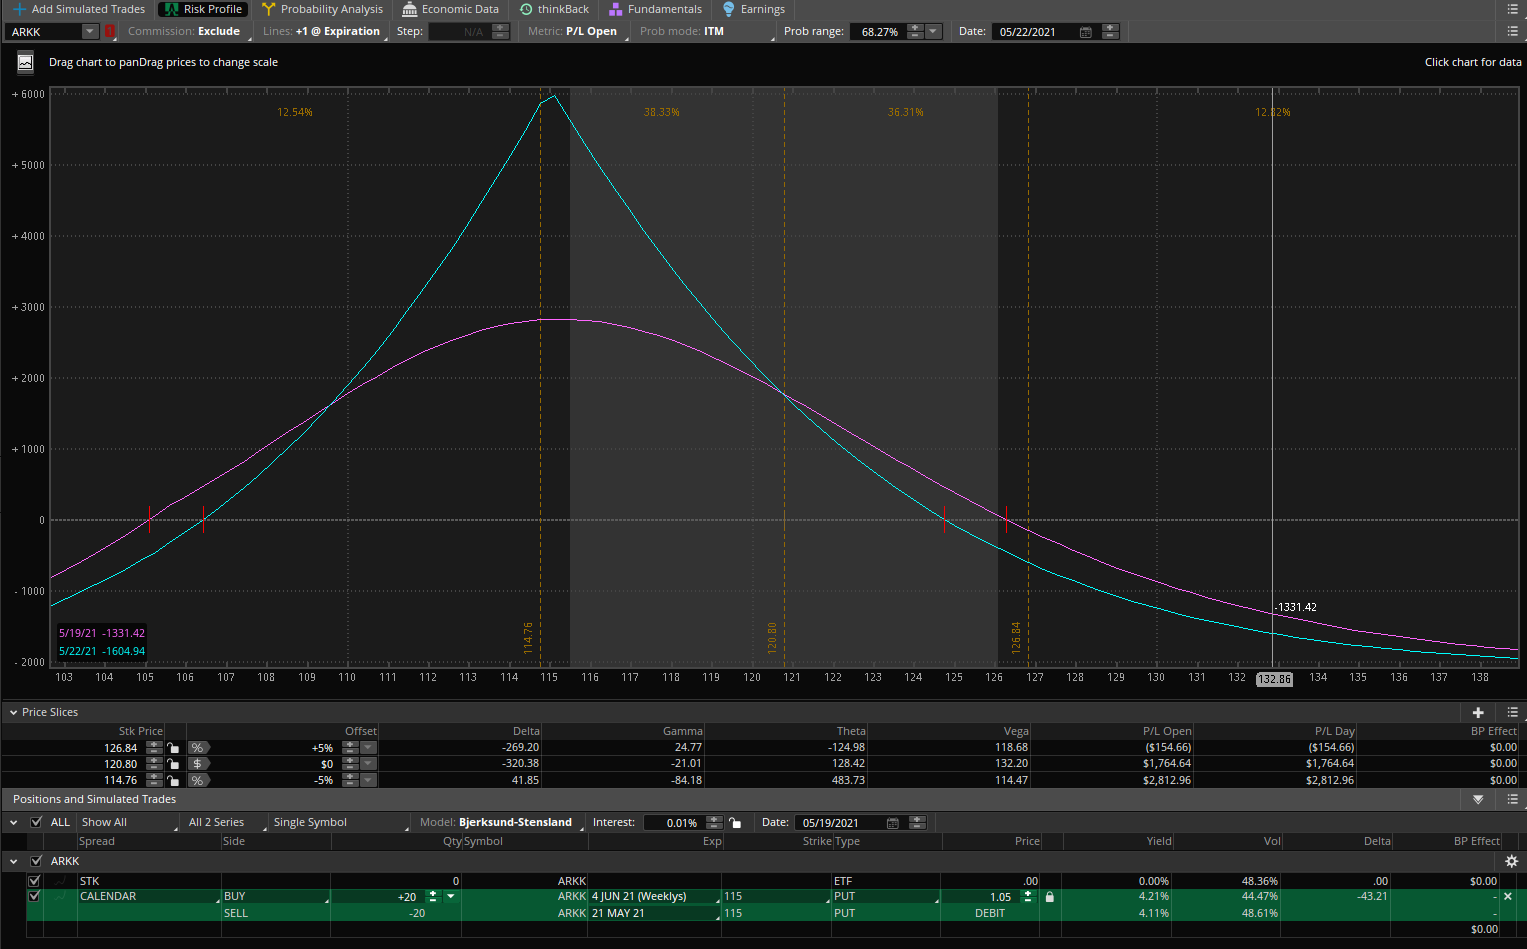
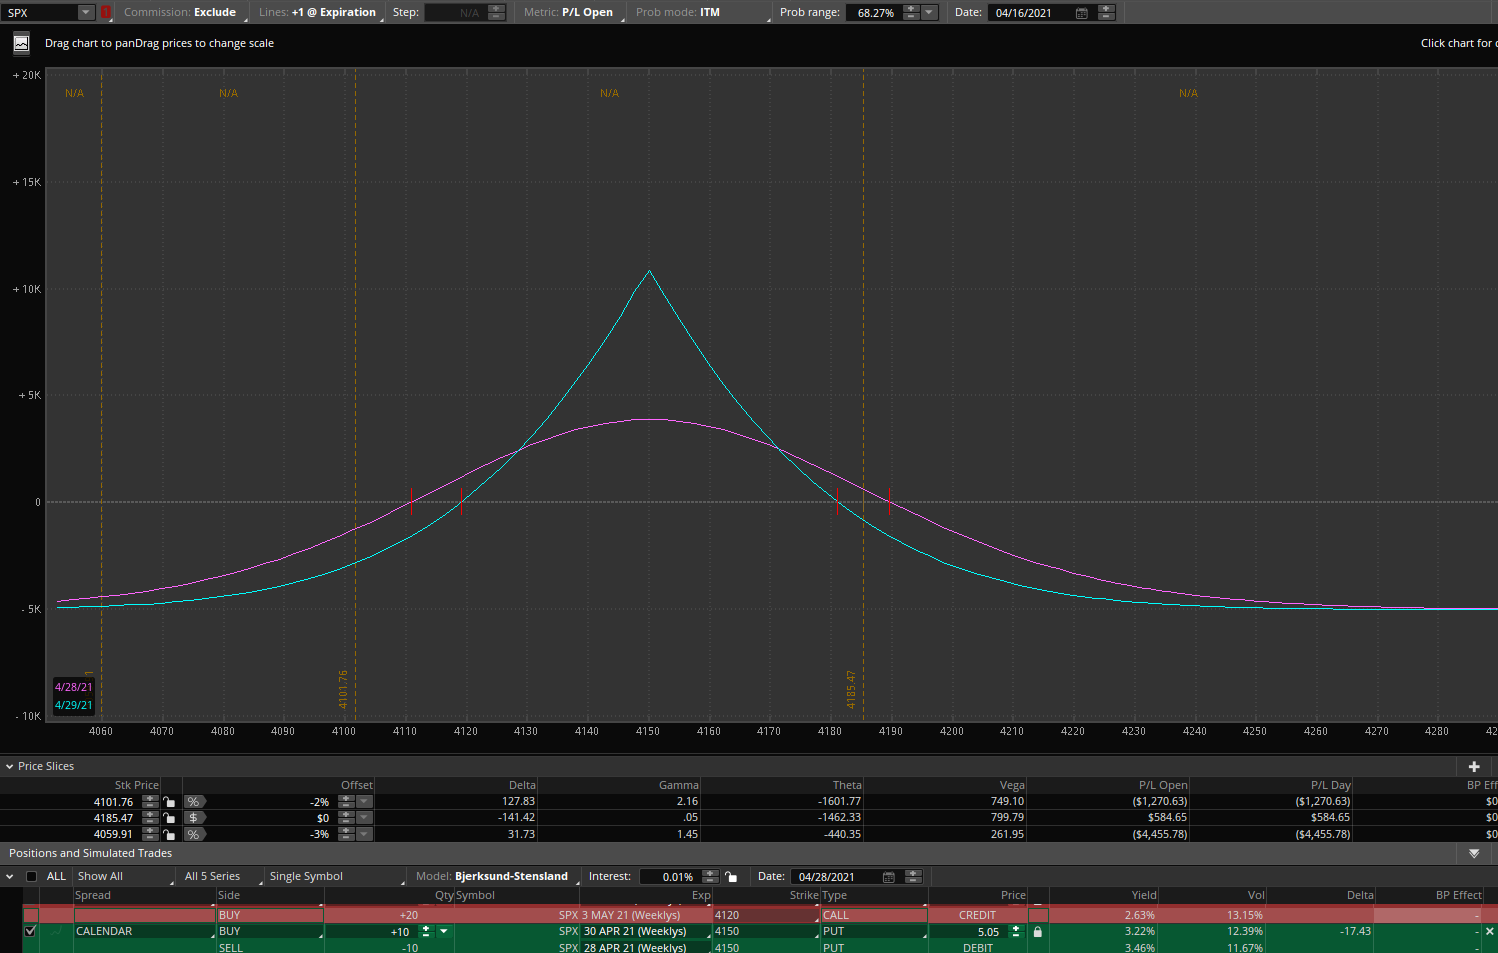
SPX Fed/CPI put calendar spread
Sell 4500 Dec 12th put
Buy 4500 Dec 15th (AM) put
Net debit: $4.80-5
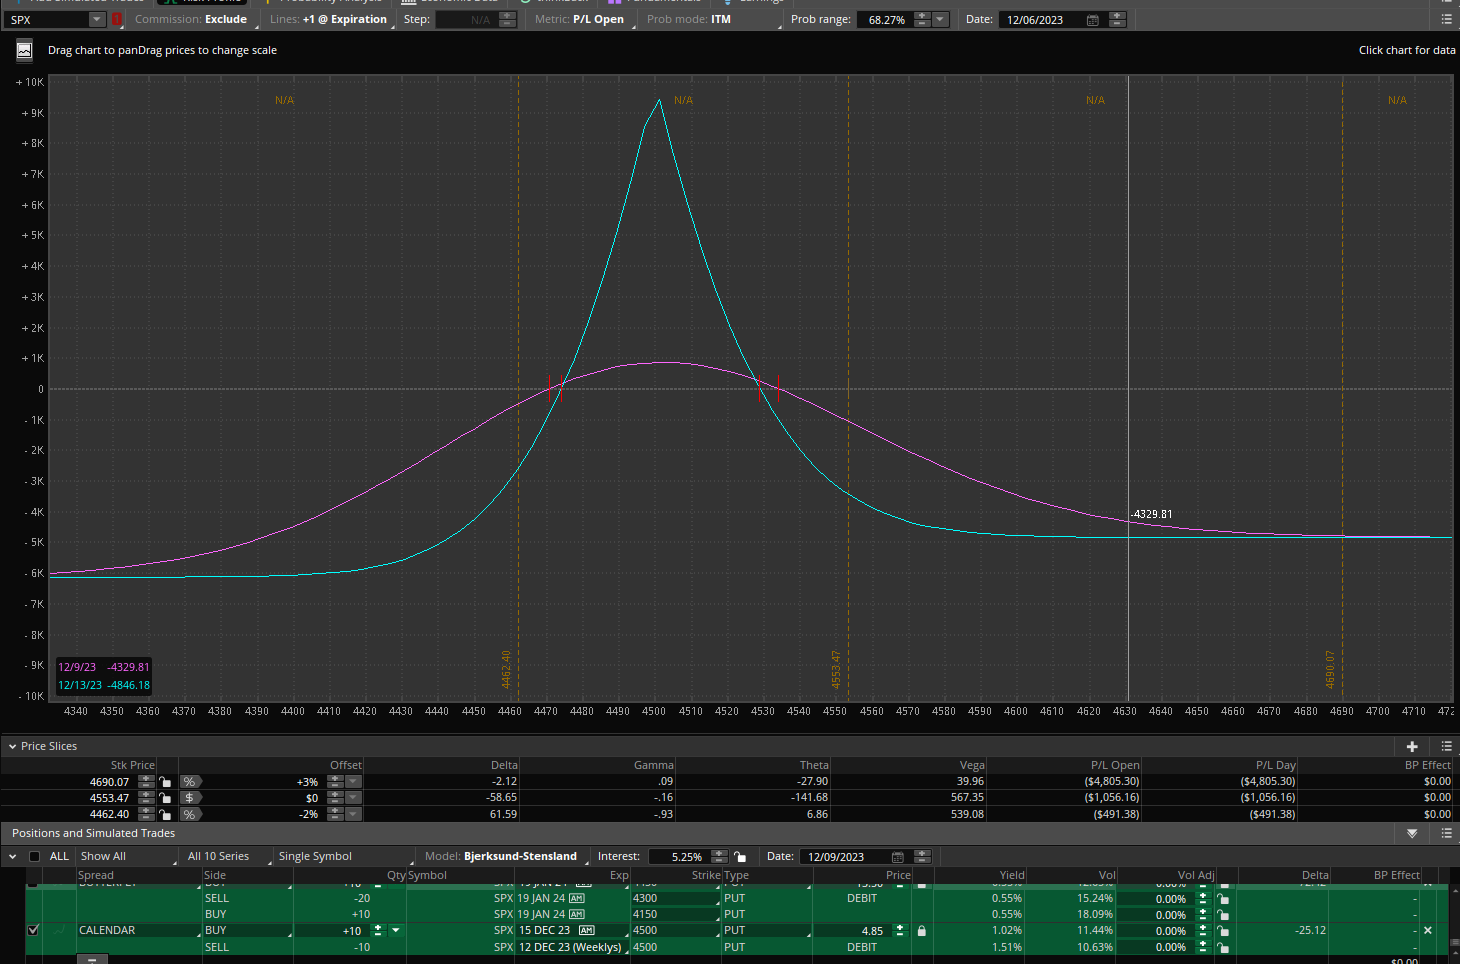
Quarterly expiration, CPI and the Fed meeting in the back leg for less than 5 SPX points 1% below spot price. Target $10-15.
Volatility Analytics Newsletter – November 21st
The turkeys are stuffed with giga tech calls – Gobble up some SPY fed week calendar spreads
Volatility Summary
What can you say about Monday other than it’s as close to homemade QE as you can get? These statistics are just astounding when you consider for the length of time it has been going on now:
You saw it again, the ‘catalyst’ was supposedly a meaningless 20-yr auction, when in reality 0DTE algos and humans that are not blind to this hoarded calls and forced dealers to be buyers of futures until 3:30pm when some of those hedges came off and the market actually ticked down for a few minutes.
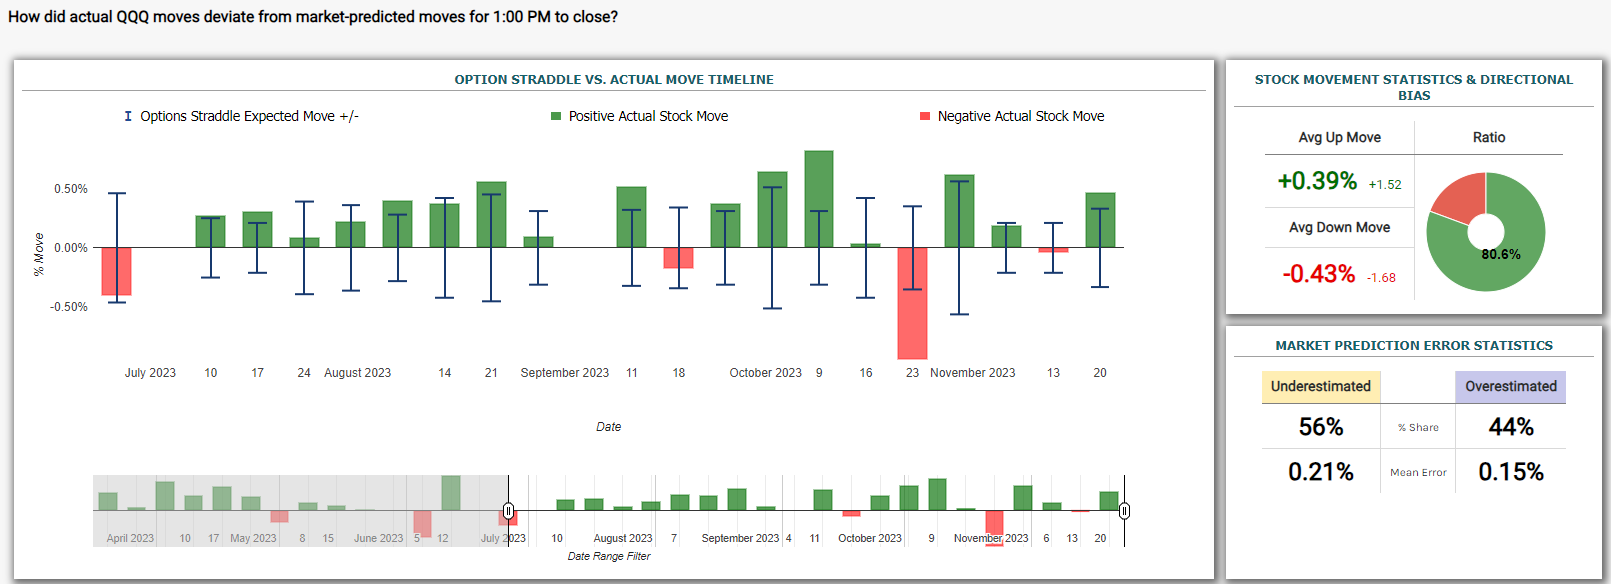
Looking the above chart, I’ve mentioned that in several instances for the last few months in the timeframe on Mondays from 1pm to close, QQQ can actually outperform not only the call pricing but the straddle pricing. So, to put it more bluntly, more than 80% of the time tech stocks and QQQ rise in the afternoon enough so that long calls and long call verticals are winners. Over and over again.
And why not again this week? I’m sure a lot of folks were wondering (as I was) if the incessant panic grab of Santa calls and giga tech that continued after the short covering in IWM/KRE-like stuff ended (more on that in a minute) might show the markets an actual down day. Ho, not to be, it twas Monday after all.
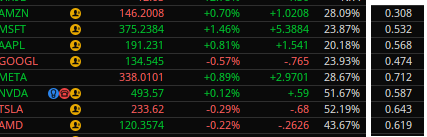
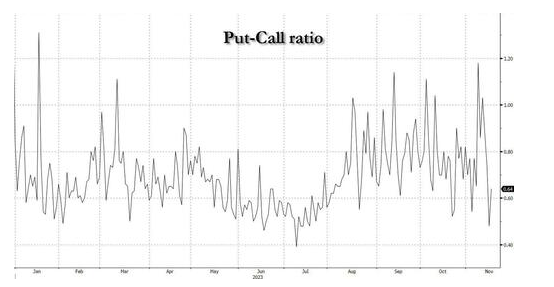
And gobbling up calls and futures they are, in the good stuff of course. Put call ratios in the mag7 were very much below 1 yesterday, meaning far more calls than puts traded.
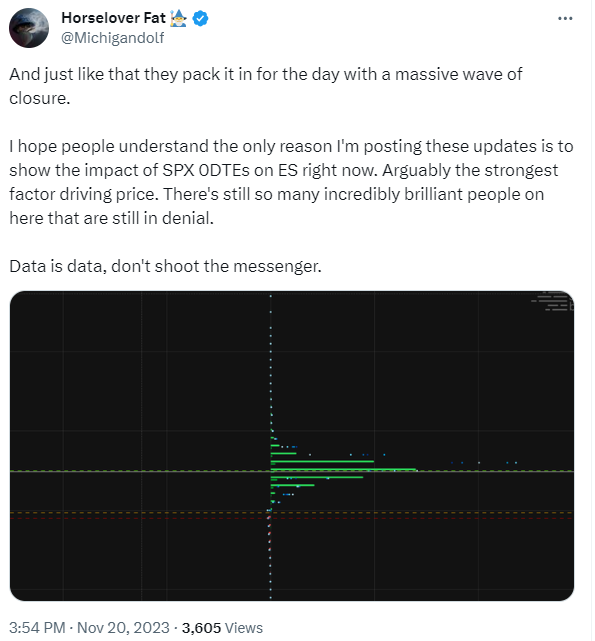
And with volume low this week, post-opex volume often is lower than usual and combined with the holiday week, 0DTE got to wag the market dog again. This great follow on twtr is all over it; here is a fine explanation of what we saw yesterday and then at the close:

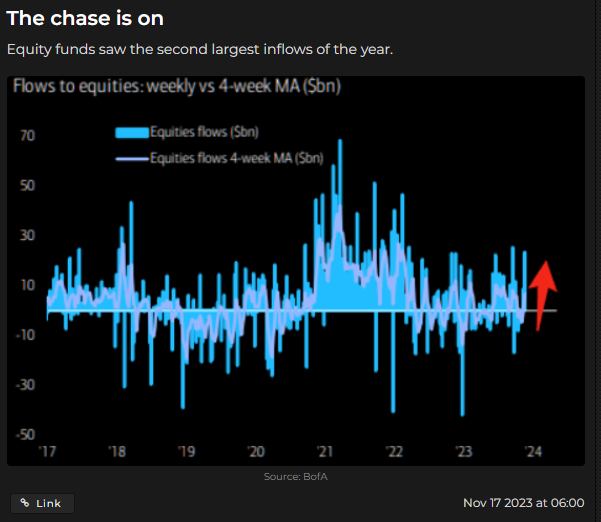
But it’s not just 0DTE- that dynamic is dovetailing with folks still simply just getting long tech and associated derivatives in many forms. SPY/SPX/QQQ/Mag7 December and January calls for sure, but this is eye-opening:
I mean, whatever’s working right? And CTAs just did some record buying:
Goldman’s trading desk confirmed our observations from the start of the month, namely that “over the last 10 days – CTAs have bought nearly $70bn of US equities…this is the largest 10d buying we have on record.”

Put/call ratios in stocks are near the lows of the year, which was if you recall when the pre-tech earnings ramp was getting ridiculous:
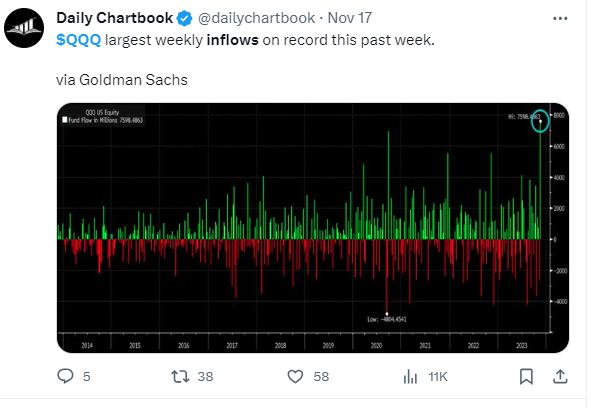
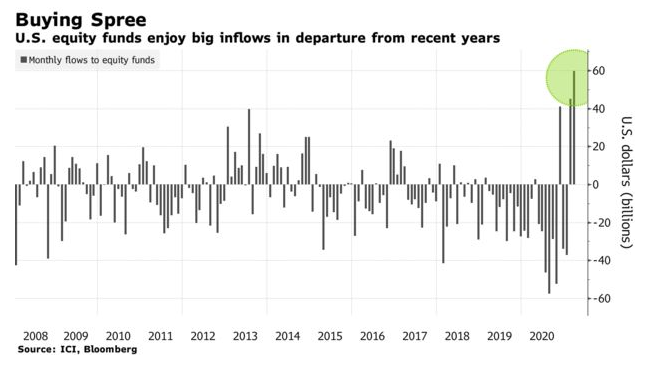
And folks are just plain ole loading up on the tech stocks. QQQ set a record for inflows
As well as a few other things in equity land, like storming back into home builders (take a gander at an ITB chart for some humor) and emerging markets, but in reality, loading up on SPY is really just buying more mega tech since the mag7 comprise 30% of the fund/index:
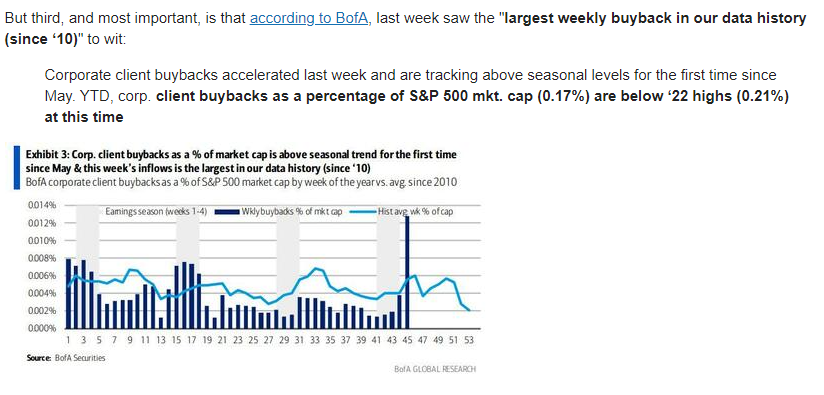
Don’t forget giga tech buybacks of course, the ‘buyback window’ opened and I suppose that means that giga tech corporate traders just hit the vwap every day since it doesn’t care about buying back stock when it’s cheaper so as to be more accretive to shareholders, right?
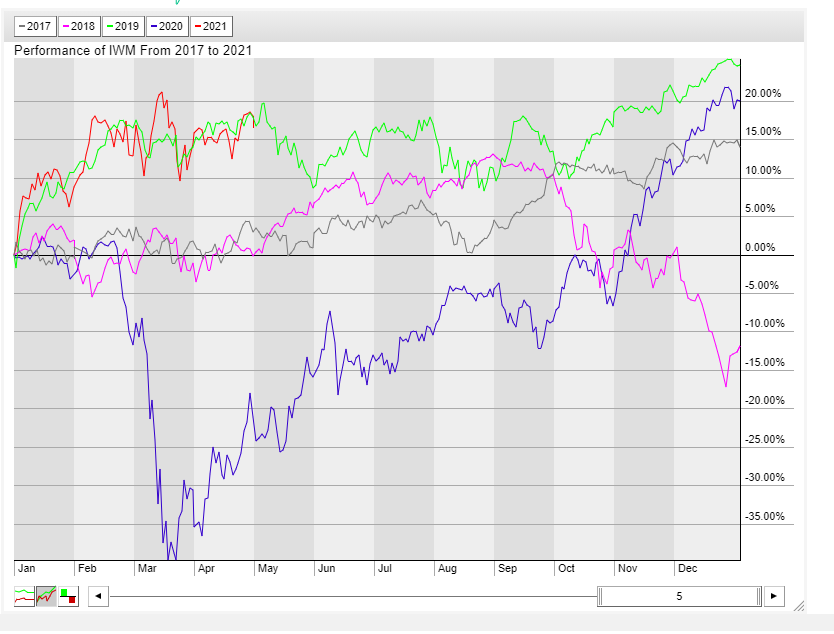
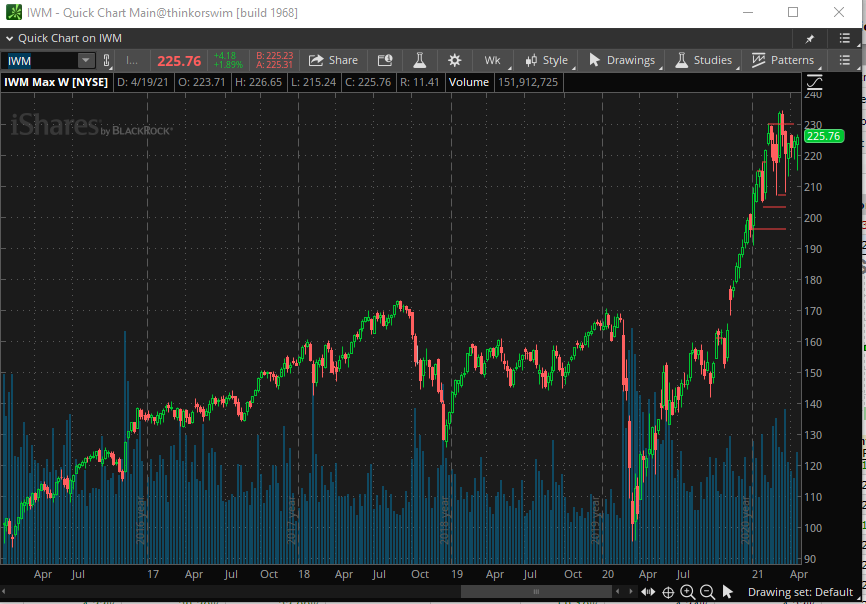
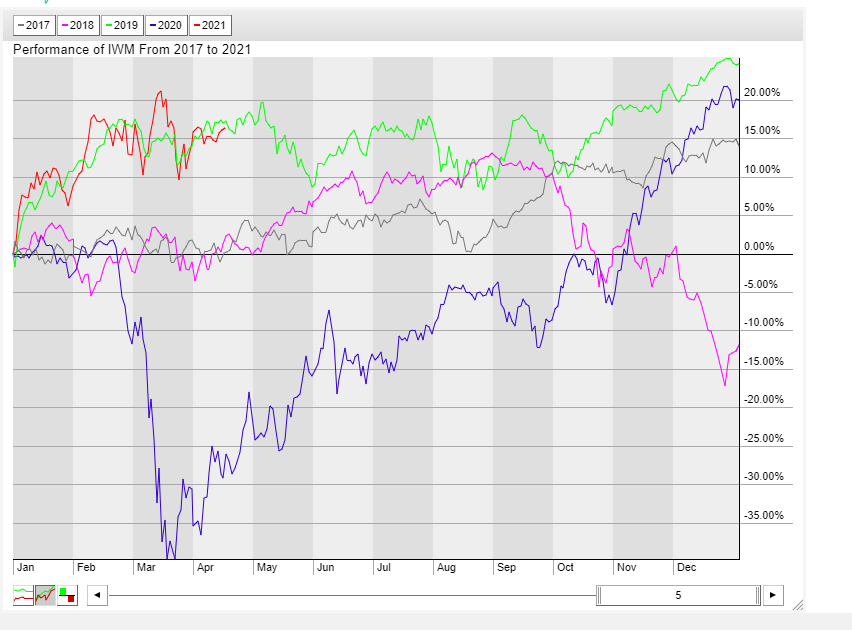
QQQ outperformance is so frothy, it is not only hitting a new high versus IWM (a record there as well, QQQ divergence from IWM) but QQQ is destroying in performance an equal-weighted version of itself!

So, it’s fair to say that in the blink of an eye, a tidal wave of long large cap tech crashed into markets this month as you can see and filled their holiday cornucopia with tech stocks, tech ETFs, tech calls, and tech futures. And a lot of it.
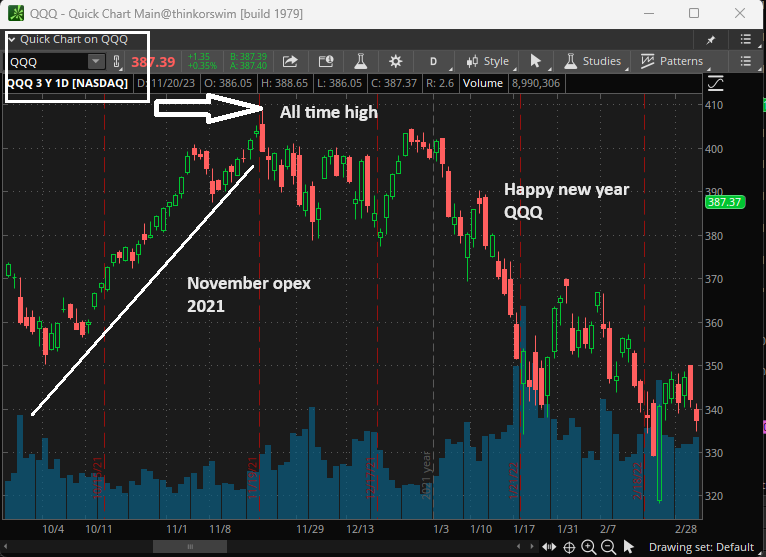
And so, I looked back at the last time we saw a huge November ramp, and when QQQ last hit it’s all time high (it’s a chip shot away now obviously), and wouldn’t you know, it was the day after November opex in 2021:
So, while implied vol is remains almost ludicrously inexpensive versus the high realized volatility we just witnessed, it’s time to carve into this stuffed bird with an eye on the Fed meeting and January’s potential tech new year sobriety.
Volatility Trades:
Fed/SPY ex-div put calendar spread
Sell Dec 8th $445 put
Buy Dec 15th $445 put
Net debit: $1-1.25

The back leg has $1.80 of ex-dividend in it, along with the Fed meeting, CPI, and quarterly opex, and it costs the equivalent of 10-12 S&P points. Simply an amazing price. I’m fairly confident that everyone long calls and tech stocks are going to be mildly aware of all these risk events when we get there. Target, 2.50-3.
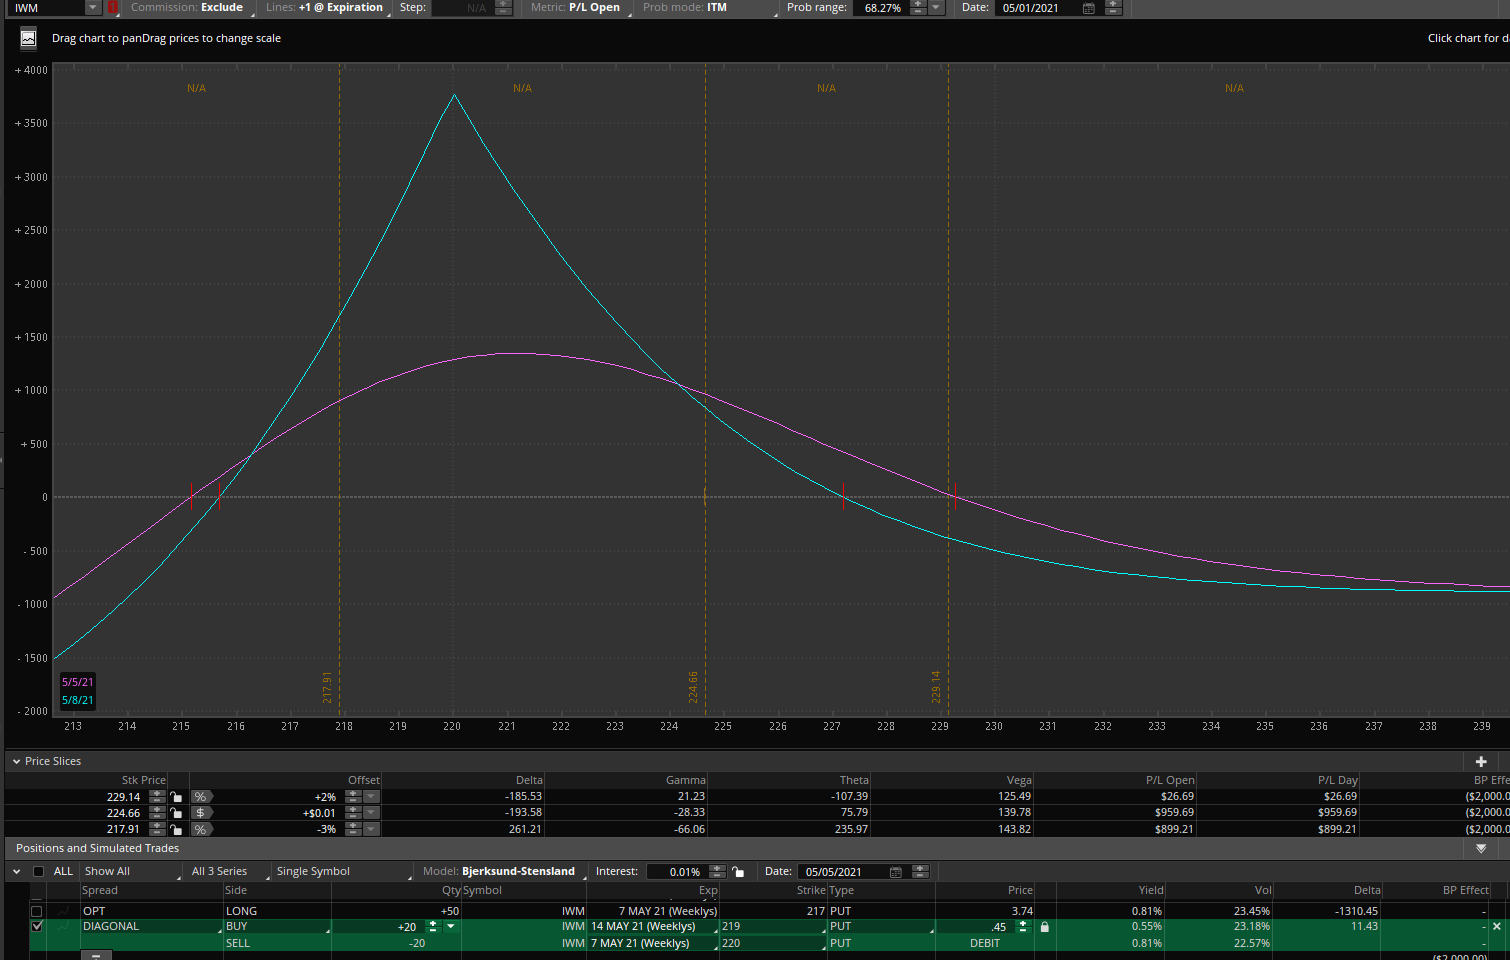
QQQ January opex put vertical spread
Buy $385 QQQ put
Sell $370 QQQ put
Net debit: $3.50
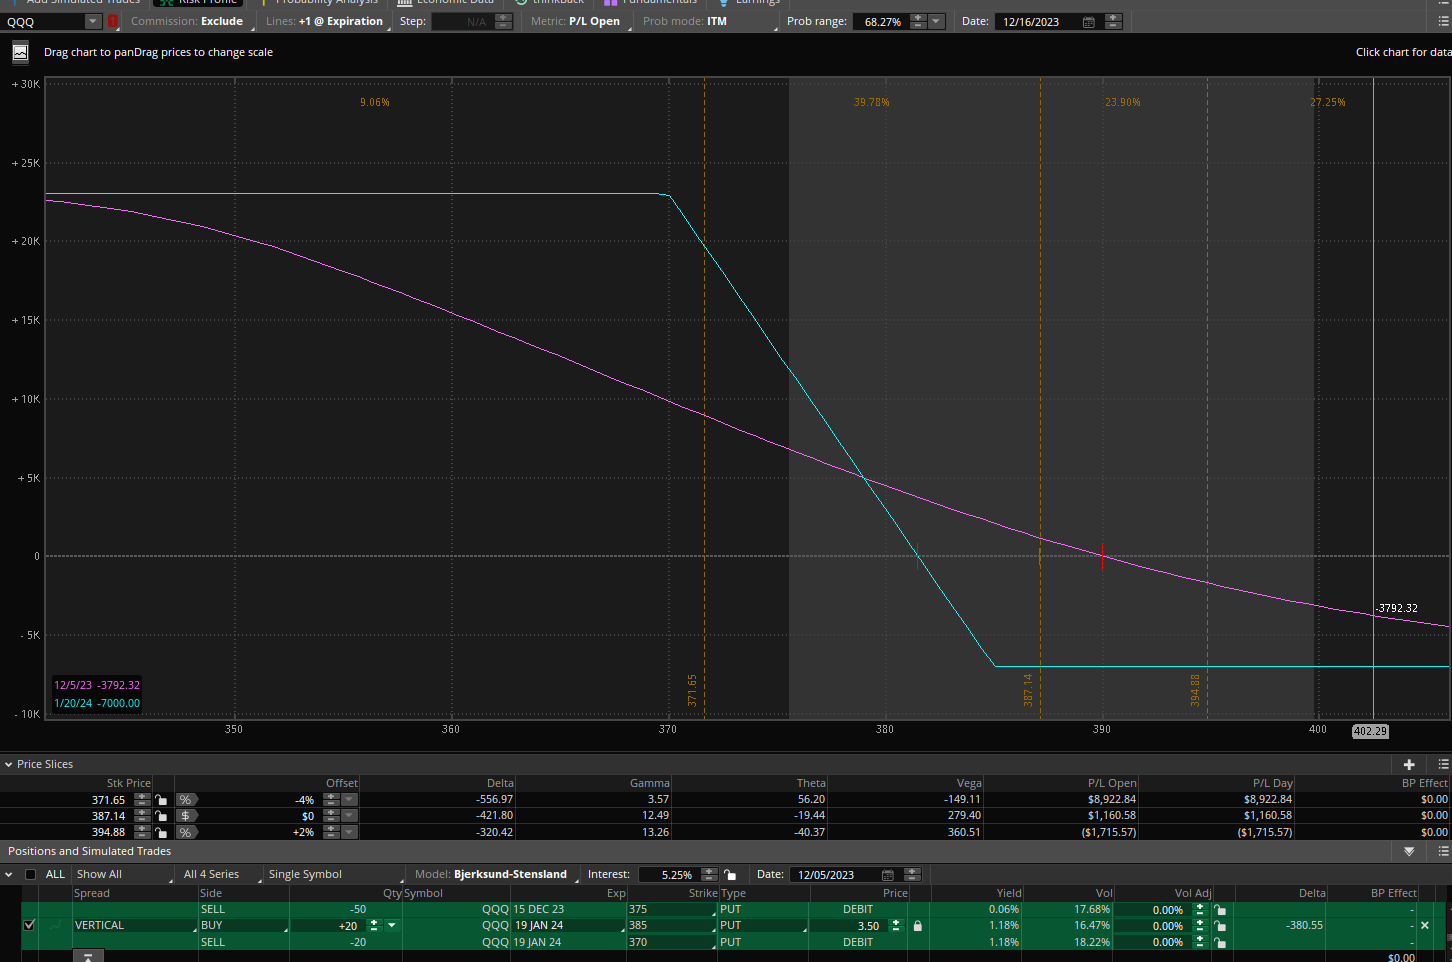
This spread is based on the above QQQ scenario and includes the fact that folks will want to window dress/avoid tax until the new year. At the time of writing, it is closer to $4 so I will watch the post NVDA earnings spike and see if I can get it cheaper then.
Have a great Thanksgiving and keep an eye on the half day. I’ve seen strange things occur on the half-day trading Friday, and with 0DTE anything can happen. For example, in 2021 covid variant news saw the SPX drop 120 points on that half day. Imagine buying half day puts for pennies and waking up to that (or being too lazy to close short puts, the horror!), someone did. Further, the Monday after Thanksgiving, doesn’t have a sanguine record either, even though Mondays are have obviously been call vol paradise.
Volatility Analytics Newsletter – November 16th
Markets await unclench – A theory on the real reason for December volatility – NVDA on deck- Fed meeting/December vol trade
Volatility Summary
Well, this opex is more like the ole days of zirp in positive gamma, at least since the post-CPI ramp locked the index around 4500. How quaint. Every intraday dip tased by the vol selling crowd. The usual giga watering holes seeing large call gamma volume. A bucolic opex week, sit on the porch, grab a sweet tea and watch the time go by.
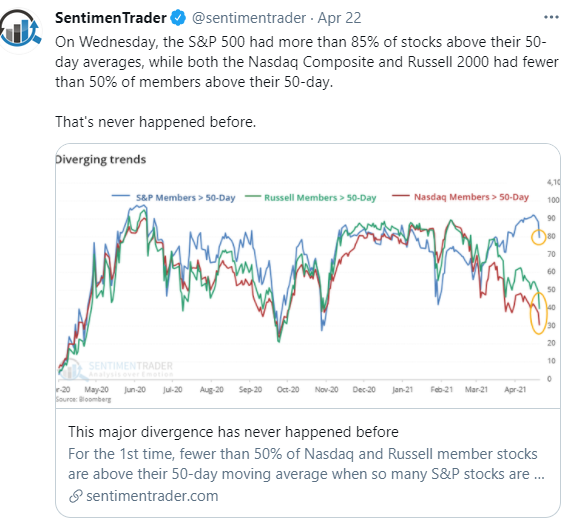
Yet, under the surface, bad breadth continues highlighted by this:
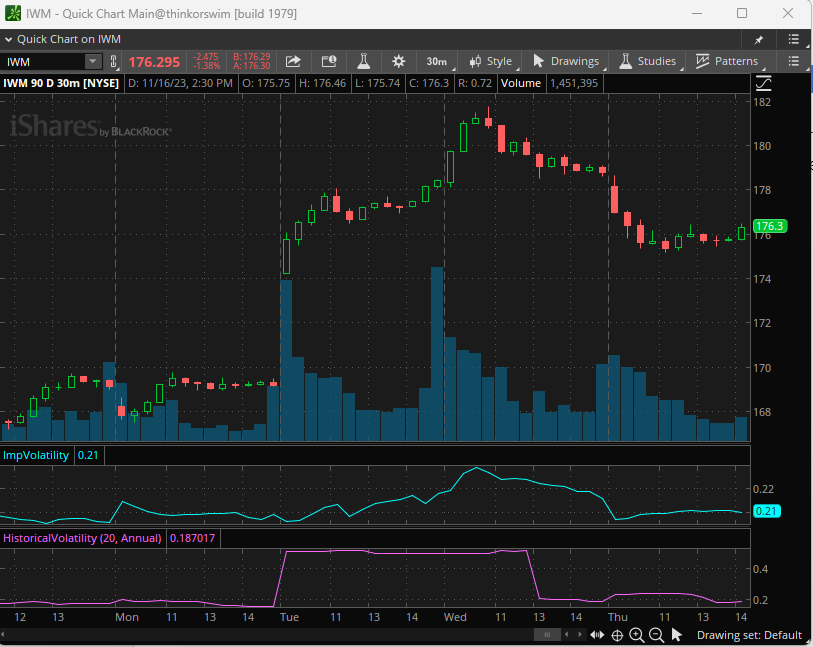
The Russell 2000, off over 1% while SPY/QQQ/DIA chop around flat. Water still hosing down the smoldering ashes of the short seller arson on Tuesday. Two interesting takeaways from the crime scene:

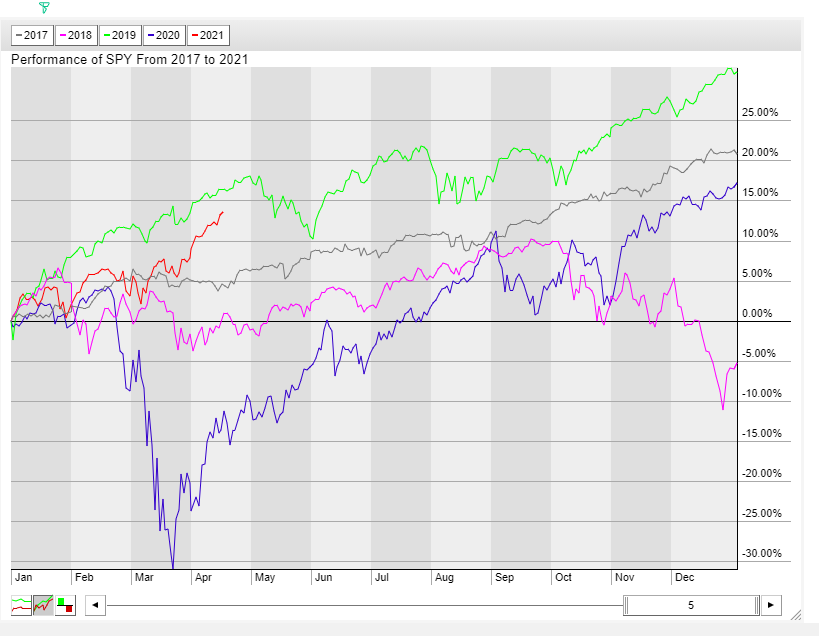
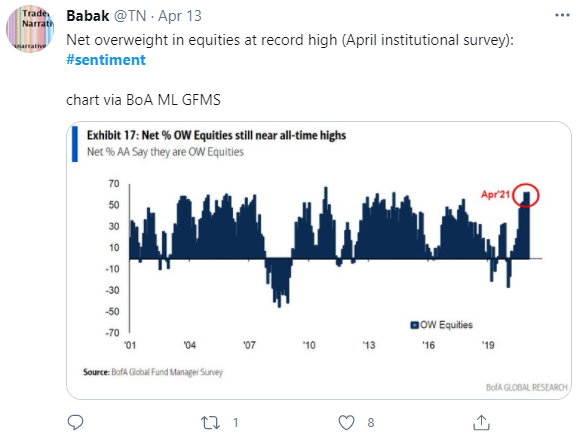
Goodness gracious, there is nothing to compare with that volume, ever. Now, here’s the thing. Sentiment shifts faster than ever it seems and it’s expressed with call buying. The options market has been democratized. Sentiment has gone from close to wondering where the Fed put was/recession is coming back to soft landing/we don’t need a recession, literally overnight. Active managers are as invested (more like long calls, right) as they were during the July earnings season:
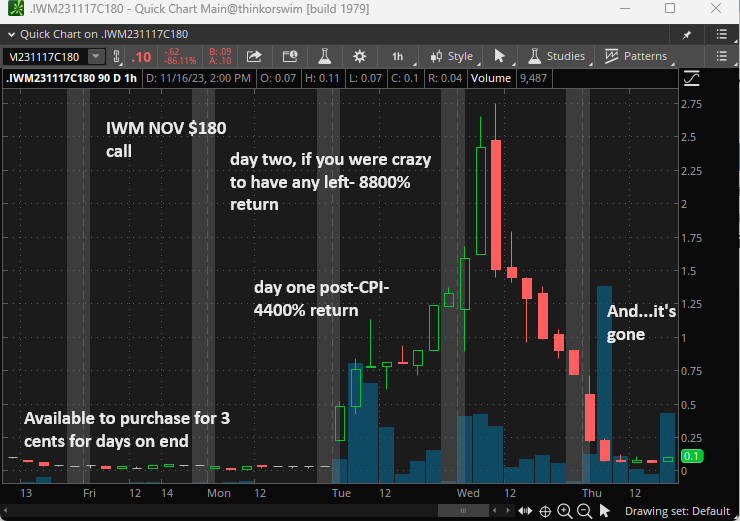
And some folks, well, they made a fortune expecting a squeeze of this magnitude. Using, yes, out-of-the-money opex expiring calls:
Now, back down most stocks slide, squeezes over, opex pinning being achieved by the Atlas’ of the markets like MSFT/AAPL holding the whole special opening quotation thing at tomorrow’s open together. (https://www.cmegroup.com/education/articles-and-reports/understanding-the-special-opening-quotation-soq.html)
(Which begs a thought for another day/note: If everyone has sold or is not interested in most stocks at this point, then what is the plan for next year? Are PMs going to simply load up on just giga tech on dips next year and expect 30% yet again? Will A.I. and valuation expansion be a 2023 redux?)
One thing I was pondering this week during the CPI gamma mayhem was the JPM collar. Can you believe that we nearly touched both sides of the collar and both Bollinger bands in only two weeks’ time? Just amazing:
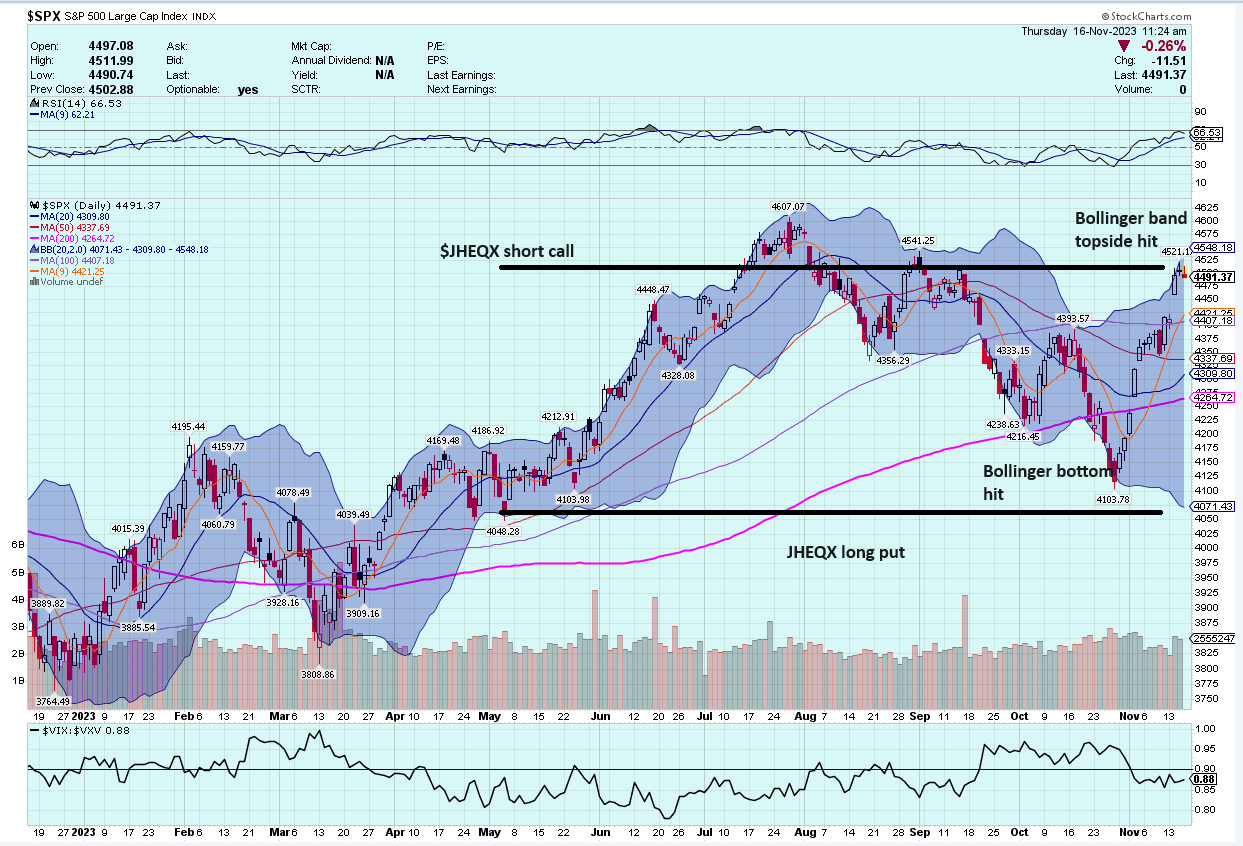
So, if you’re scoring at home, this zero-debit collar has suddenly become a liability. 41000 or so collars, the short call being worth about $76 less the long put which is about $5.50 is roughly:
41k x 100 x $70.5 = $289mm. Not exactly pocket change for a 16B fund. The good (or scary perhaps) news is that it has 45 days or so to go, so a 5% rally into year-end would really do some damage.
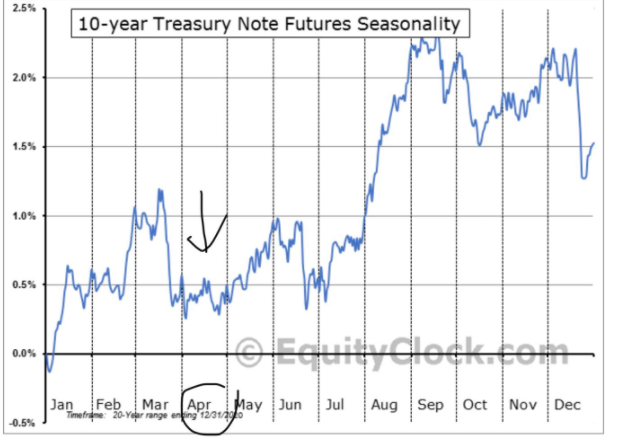
IWM calls and JPM collars dovetail nicely with my topic du jour, why December volatility tends to rise after folks are beached like orca post turkey day. Take a gander at this chart:
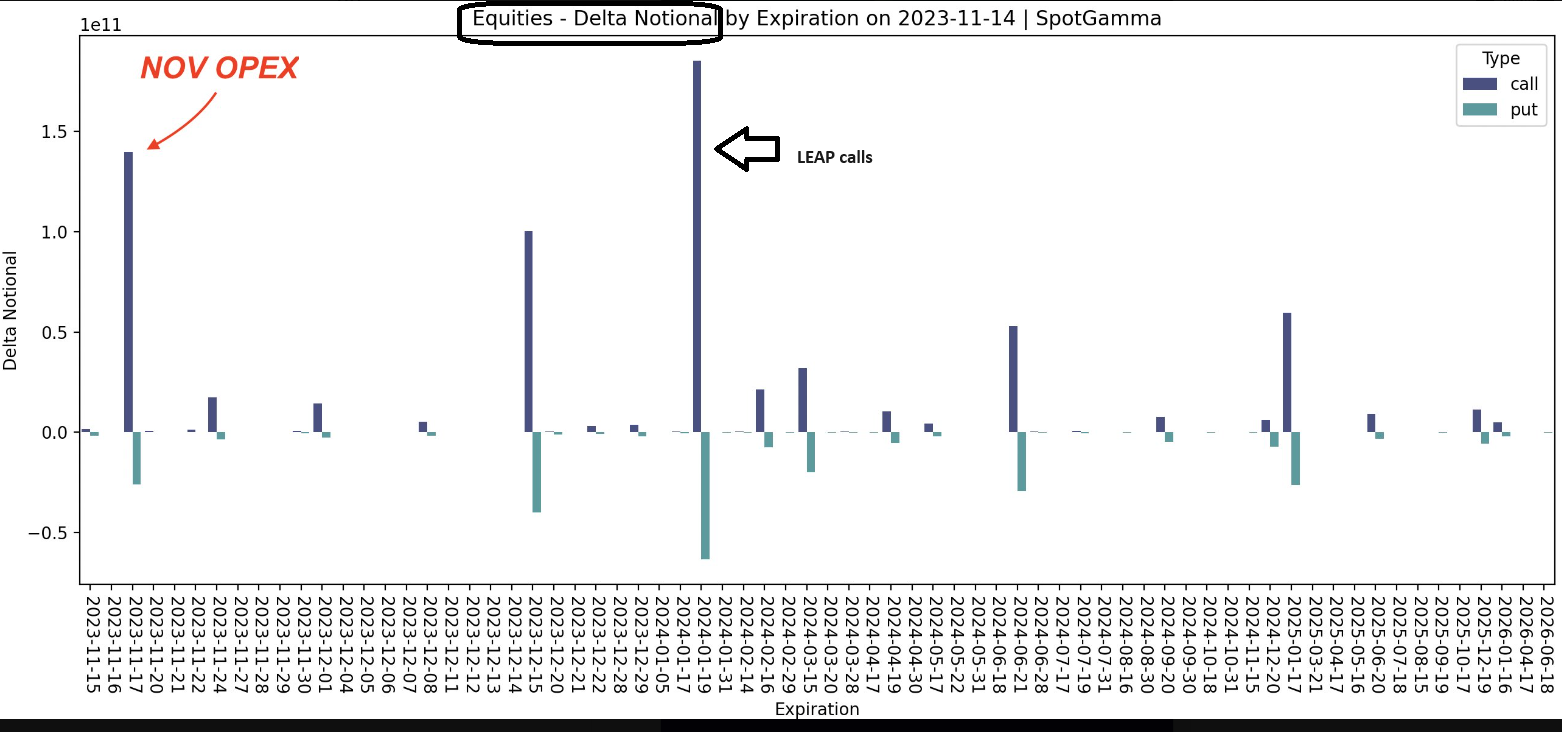
LEAPS are calls that are listed years in advance. Basically, an opportunity for someone to own long term upside without plunking down the whole stock price or paying margin fees. And you know, these are generally folks that are long calls, not short.
What does this mean? Well, as you get closer to expiration and the deltas start to decay, you know, charm, then dealers are sellers of the long hedge. So, while the models most folks use to judge whether the market is in positive or negative gamma, this sort of flips that generality on its head.
Instead of buying back the short futures/stocks when the calls the dealers are long (covered calls sold to them) decay, it’s the opposite. They are short the calls, thus long the underlying hedge and when they decay, dealers are sellers.
Take a look at the big tech stocks, at the open interest for January LEAPS, it’s huge. Combine that with a lot of folks that most certainly got long calls in November post-Fed, when the seasonality/technicals/breadth thrust, what have you, signaled them to shift sentiment and go long December Santa calls as well. What you have is a lot of long calls that on a bad day in the market in December, go up in flames and dealers do a lot of selling. Hence, December volatility.
Just my theory, mind you, what exacerbates December vol. In the meantime, keep an eye on SOQ in the morning, how the market acts on that minor unclench, the markets after 3pm when there is more unclenching, and finally, if the S&P parks here, then Monday/Tuesday could be very interesting. NVDA is clearly the main event next week, so it’s harder than usual to gauge how vol is going to act vis a vis unclench.
Volatility Trades:
SPX Fed meeting put butterfly spread
Buy 4450 Dec put
Sell 2x 4375 Dec put
Buy 4300 Dec put
Net debit: $6-6.50

Another byproduct of an opex week like this is the room service hop that the low vol of the week gives you to set spreads for very low prices. 6 points of cost for owning 4450-4375, 8% of the width. Only 1% lower it starts to earn, and rapidly. And this spread holds a slew of risk events, JOLTS/CPI/Fed meeting/quarterly opex….It’s priced as if the odds of the market having a down day in the next month are close to non-existent. Target- $12-15.


 O
O


![2014-08-15 07_54_32-_VXU4 - Quick Chart Main@thinkorswim [build 1864.10]](http://www.volatilityanalytics.com/wp-content/uploads/2014/08/2014-08-15-07_54_32-_VXU4-Quick-Chart-Main@thinkorswim-build-1864.10.png)