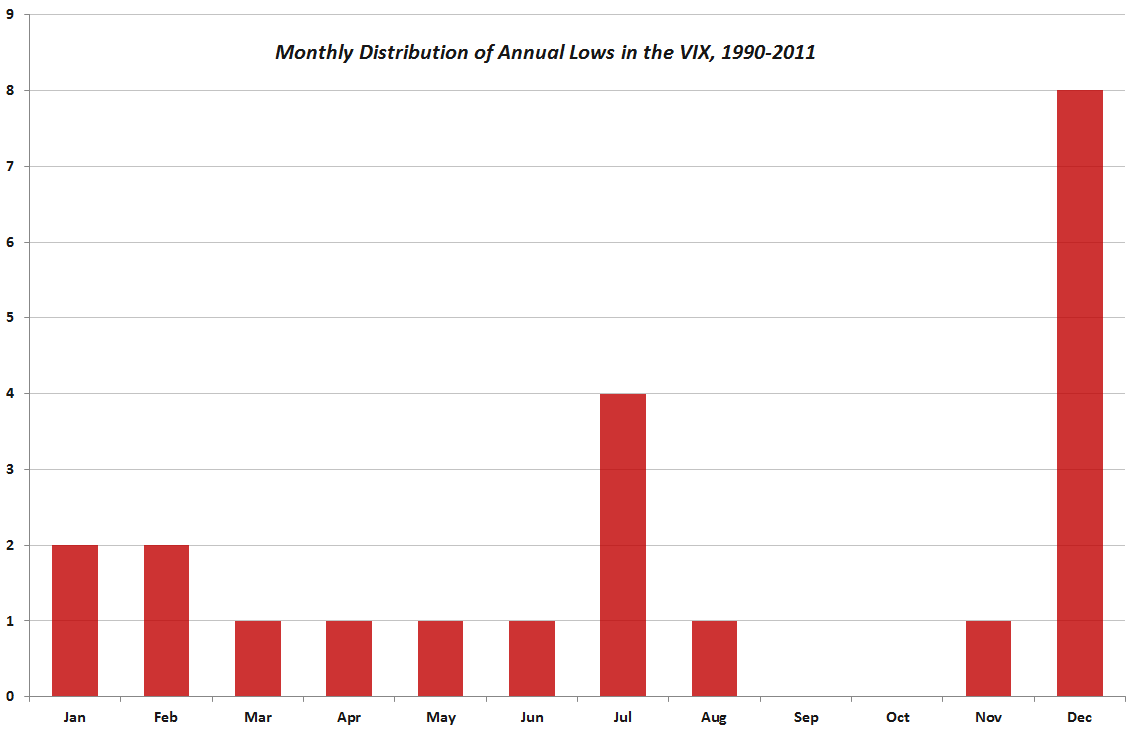
One might imagine that volatility would be somewhat elevated, especially now that we are entering a period where fiscal cliff political rhetoric and grandstanding could threaten market performance. In an investment world where the calendar means so much, skittish managers are caught between chasing the S&P 500’s out-performance versus closing out positions for the year, locking in gains against potential tax increases, shedding losers, and window dressing.
Today the algos hit the tape on Senator Reid’s comments, just a daily example of the headline-programmed high frequency traders moving the market. And with hedge funds getting badly beaten by the S&P, this is creating a very difficult situation, in a time period when the market performs quite well historically. December is the #1 S&P 500 month since 1950 for performance and #2 on the Dow and Nasdaq. So what do you do, invest client funds just to watch them crater whenever the circus in Washington decides to put personal objectives ahead of the U.S. economy? Just in time for those statements to get printed.
Hedge Funds Badly Beaten by S&P 500 Performance
Just 13% of hedge funds are beating the broad market indicator
http://www.advisorone.com/2012/11/26/hedge-funds-badly-beaten-by-sp-500-performance
The VIX has taken this pending situation with nary a quiver yet, but this may be due to the seasonal tendencies of the VIX. (see our recent posts for more on VIX seasonality) While exchange traded funds holding VIX futures have multiple headwinds, the differential between the near-term VIX futures contract and the VIX is not one of them:
The spread between the December VIX futures and the VIX is only 1.4%, and the VXX short-term futures ETN has just rolled to hold all Decembers a few days ago. Therefore, a spike in the VIX will translate to a highly correlated spike in the VXX. This is fairly rare, since there are usually multiple buffers to prevent this type of action. Only for a short time period will the fund hold a vast majority of near month futures, and rarely with this much time until expiration will the VIX/VIX futures spread be this tight.
The bottom line is that the VXX is not as bad a hedge against volatility as it usually is. Let’s examine a long volatility trade:
December VIX option at the $15 strike – $1.80 (VIX current price $15.72)
December VXX option at the $30 strike- $2.00 (VXX current price $30.36)
The VIX options represent expectations of the forward value of the VIX; that is essentially what the VIX futures represent. For 12% you get an at the money hedge against the VIX. For 6.6%, you get almost the same hedge. The negative roll yield is -.5% per day, so that should be factored into the trade. Yet, you will get a better response on short-term spikes with the VXX. Today exemplified this mispricing as the VIX $15 strike option traded 16% higher and the VXX $30 strike option moved 26%. The VIX index rose only 2.7%. This result makes perfect sense considering the price inequity.
Believe it or not, this is usually the reverse of the typical VIX/VXX arbitrage trade setup where you get long VIX options and watch the short VXX options decay due to the normal yield and spread scenario.
Follow us on Twitter and Stocktwits @VolatilityWiz, and visit our website for trading ideas at VolatilityAnalytics.com. We have proprietary strategies for both institutional and retail investors.
VIX Term Structure:
|
Trade Date |
Expiration Date |
VIX |
Contract Month |
|||||||||||
|
11/27/2012 15:14 |
22-Dec-12 |
15.71 |
1 |
|||||||||||
|
11/27/2012 15:14 |
19-Jan-13 |
16.24 |
2 |
|||||||||||
|
11/27/2012 15:14 |
16-Feb-13 |
17.2 |
3 |
|||||||||||
|
11/27/2012 15:14 |
16-Mar-13 |
17.95 |
4 |
|||||||||||
| VIX Futures: | ||||||||||||||
| VX Z2-CF | S&P 500 VOLATILITY | Dec-12 | 16:40:51 |
16.15 |
0.55 |
15.65 |
16.25 |
15.45 |
||||||
| VX F3-CF | S&P 500 VOLATILITY | Jan-13 | 16:40:53 |
17.8 |
0.32 |
17.45 |
17.9 |
17.2 |
||||||
| VX G3-CF | S&P 500 VOLATILITY | Feb-13 | 16:40:54 |
19 |
0.23 |
18.63 |
19.05 |
18.43 |
||||||
| VX H3-CF | S&P 500 VOLATILITY | Mar-13 | 16:40:54 |
19.85 |
0.23 |
19.5 |
19.95 |
19.39 |
||||||
Data courtesy of the CBOE.

