VolatilityAnalytics.com

  • About the Volatility Analytics Newsletter
  • Contact
  • VIX 101

VIX Falls 10% – Futures Curve Steepens

Posted by Scott Murray on August 11, 2014
Posted in: Uncategorized. Tagged: VIX, VXX.

There was no news of significance today, and European markets led the U.S. into a higher open. That open was almost precisely where we closed, and since the S&P 500 was up around 12 pts at the high, a 6 point advance from open to close formed a shooting star candle. A lot of traders love to call this a bearish reversal or ugly candle, but the data does not support that. Bulkowski’s data demonstrates that it is merely a random probability what follows a shooting star:

http://www.thepatternsite.com/ShootingStar.html

The VIX took the lack of bad news pretty hard as it fell to around 14. Today had the feel of a typical summer session, with low volume and low volatility the characteristics of the day. The VIX term structure steepened and contango widened in the front months of the VIX futures curve:

vixterm811

Meanwhile, this was the trip for the September future. This is the only thing that matters now for VXX and UVXY holders, as it dominates their holdings:

vxsep811

This kind of action in the primary long holding in UVXY did some damage to the UVXY short $100 calls, which of course worked well for subscribers:

uvxy100811

The VIX reached July 30th levels:

vix811

Our next letter for subscribers will be published tomorrow night. I anticipate a few new trades this week, and we are on quite a roll lately….

Click the link above to subscribe to the newsletter for $25/month.

VIX Futures Make New Highs While Spot VIX Falls Short

Posted by Scott Murray on August 7, 2014
Posted in: Uncategorized. Tagged: uvxy, VIX, VXX.

Trends are the name of the game to algos and a lot of traders, and today’s action was almost methodical in adhering to the short-term bearish trend that has been in place for nearly two weeks. August is living up to its reputation as the worst month for the indices since 1987, and every small bounce is being sold. If you are a short-term trader, buying the VXX dips is working wonderfully.

I’m not that type of trader, I like to think of shorting mispriced options as more of an investment. Wait patiently for good prices, then be a little contrarian in behavior with a longer-term view. We are getting some nice prices now, if you can handle the how these options fluctuate in value in the short term. But realistically, the calls I’ve been selling have almost zero chance of being worth anything come expiration. There is no financial crisis looming like there was six year ago, central banks are far to accomodative, corporate earnings are too good, and economic data for the most part is just fine. What we are seeing in the markets is quite normal behavior.

As the selling resumed today, the front month future reached a high point going all the way back to tax day 2014:

vx87

While the VIX itself was rejected at last Thursday’s level:

vix87

Being that this is the week before options expiration, its not surprising that volatility is high, or at least high relative to recent times. A peek at the VIX wave for this OPEX cycle shows that it tends to fade in August after this week. Tomorrow is day 15:

vixwave87

The S&P 500 found a little support at the 100 day moving average. And as you can see from prior trips to the 100 this year, a few closes below it didn’t really mean much:

spy87

The IWM is still showing more of a basing pattern than the Dow or S&P:

iwm87

And the highly watched Dow transports spent most of the day in positive territory as it nears the 100 day moving average. The selling here is getting old as well:

iyt87


And breadth is starting to turn internally. Look at the NYMO:

nymo87

And the stocks trading below their 50 day moving average has reached back to 2012 levels:

50sma87

The bottom line is that we could have a washout and higher volatility, but we are due for a bounce.

VIX Futures Make a Round Trip – Short Options Weaken

Posted by Scott Murray on August 6, 2014
Posted in: Uncategorized. Tagged: VIX, VXX.

This was the day in the August future:

vx86

After the Polish minister news was blamed for the 15 handle S&P dip in 30 minutes yesterday, the DAX opened sharply lower boosting the VIX futures at around 3am. When the SPX bounced early, the VIX fell but as it was yesterday afternoon, selling reemerged to bring the VIX futures to unchanged.

Yet our short UVXY $100 Jan calls fell anyway:

uvxy100

The ECB meets tomorrow under the specter of correcting markets in Europe. Take a look at the DAX, it is now in a 10% correction:

ewg86

Mario, not unlike Helicopter Ben, is usually good for markets. Already having instituted a negative rate window, now asset purchases are on the table. Should be an interesting day tomorrow.

A couple more interesting charts: the Rut2k is finding a base and is now outperforming the S&P over the last few days, and the IYT Dow Transports are still beelining for the 100 day MA. Incidentally the DOW is only 100 or so points from the 200 day moving average.

Iwm86 iyt86


Economy Strengthens, Earnings Look Great and the VIX Surges – Why?

Posted by Scott Murray on August 5, 2014
Posted in: Uncategorized. Tagged: VIX, VXX.

Pundits in the financial media are working overtime to explain a natural price action in equities. An old axiom by Jessie Livermore postulated that news follows price and that is what is happening these days, especially when ISM services came in at an all-time high (established in 2008, not a huge hurdle mind you), and S&P 500 corporate earnings are poised to grow 10% year-on-year. So the du jour explanation was an old story about more troops on the Ukrainian border.

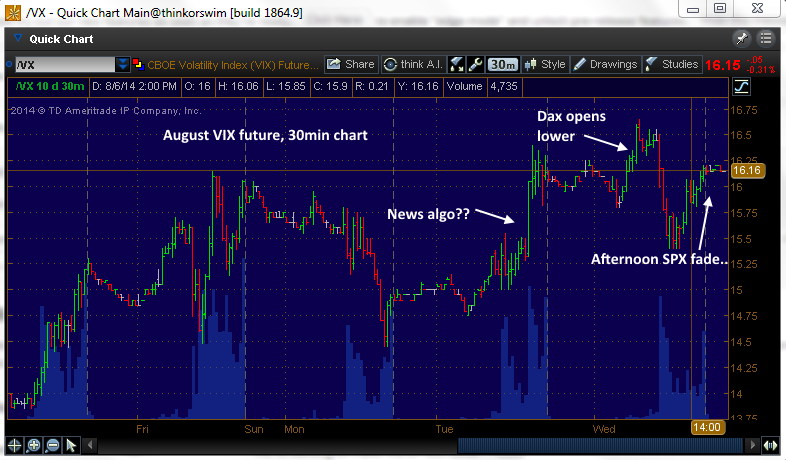
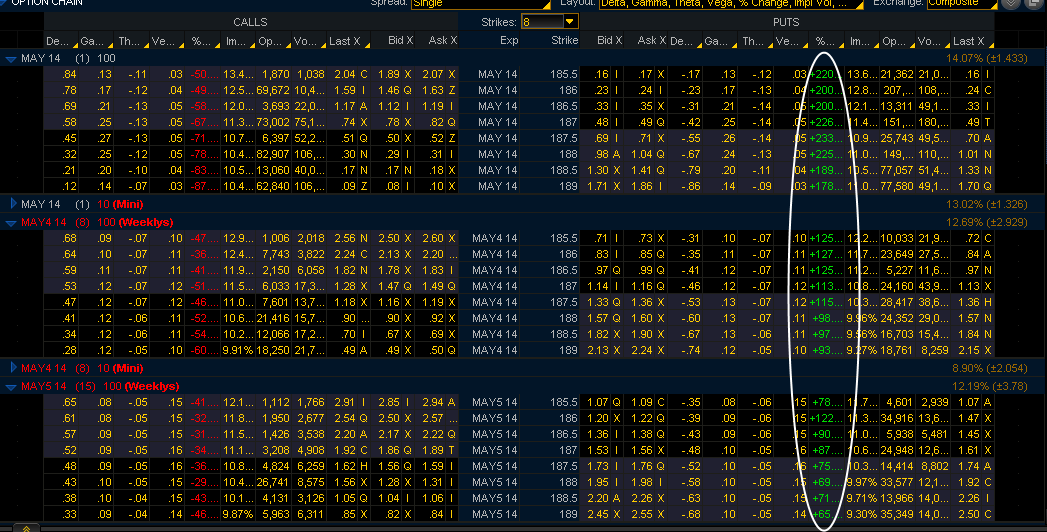
So maybe there was a runaway news algo at 1pm today, who really cares? These times are a gift, either for those looking for cheaper stock (re:Warren Buffett et al, he has a record cash horde) or for those looking to sell some expensive volatility premium. I fall into that camp of course, and these days are great.

First some common sense, and then some data. Do you really think Russia wants to invade the Ukraine? Probably not. But if Mexico or Canada were in the midst of a civil war, would the U.S. move some of their otherwise idle troops into a nearby area in case something occurred? Of course.

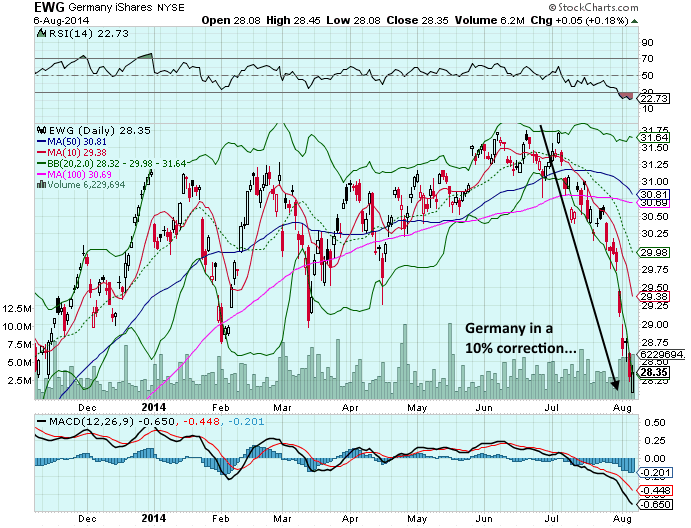
Secondly, if the Fed raises rates, is that such a bad thing? Ok, maybe the cost to buyback stock gets more expensive, but retirees get to spend more money via their less risky savings/treasuries investment returns, and banks can loan more money as their portfolios are less risky. (At higher rates, loan portfolios can handle more defaults, thus more lending.) Both of those are positive for economic growth, and thus corporate earnings. The financial sector is the S&P’s largest, and they would love to loan at higher rates instead of being a conduit for refis. Look at the KRE, the regional banking ETF, it is down 7% this year and that correlates almost perfectly with the rally in bonds.

So the market is overreacting, right? No, the market has to go down sometimes, that is how money gets extracted from stocks and if you believe the Fed is pumping it up to boost the economy that is a good thing. People forget that outflows have to go somewhere else…

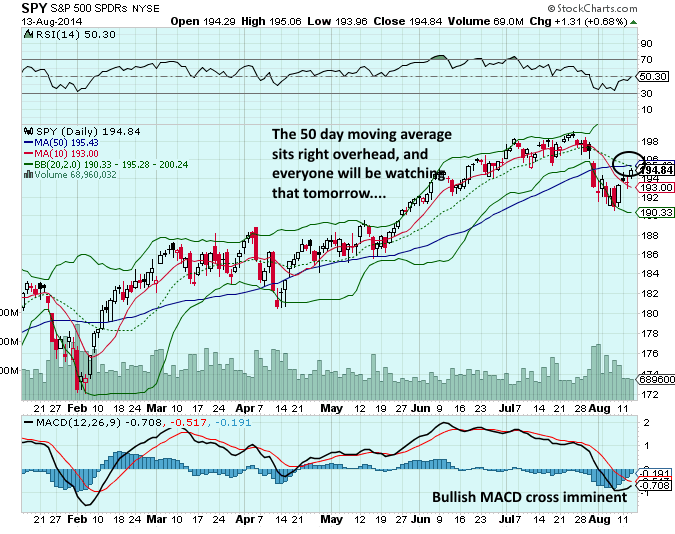
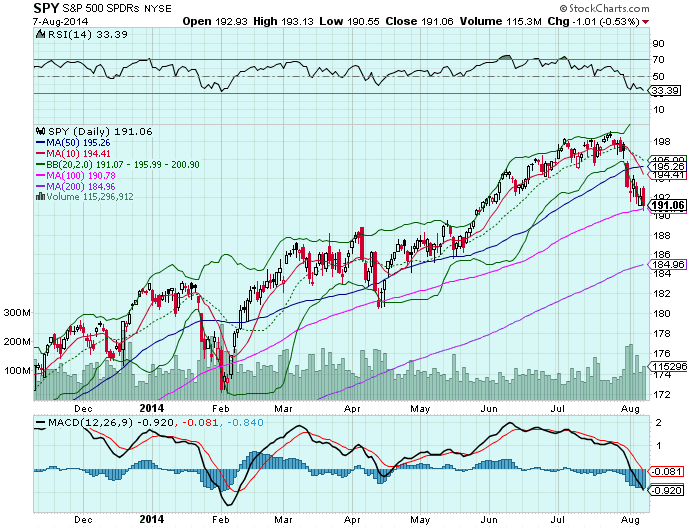
In reality, this is just another seasonal and normal dip/correction, whatever you want to call it. August ranks last in all months for performance on the S&P 500 since 1987. Sometimes market selling leads to more selling, and the technicals are broken in the short term. Look at the SPX:

spx85

Looks ugly, but there’s obvious support nearby. Keep in mind that earnings are winding down, and stocks tend to get faded after the earnings season ends. Mid-August historically is stronger than the beginning. Yet, this was a real bright spot today, if you want this correction to end…


rut85


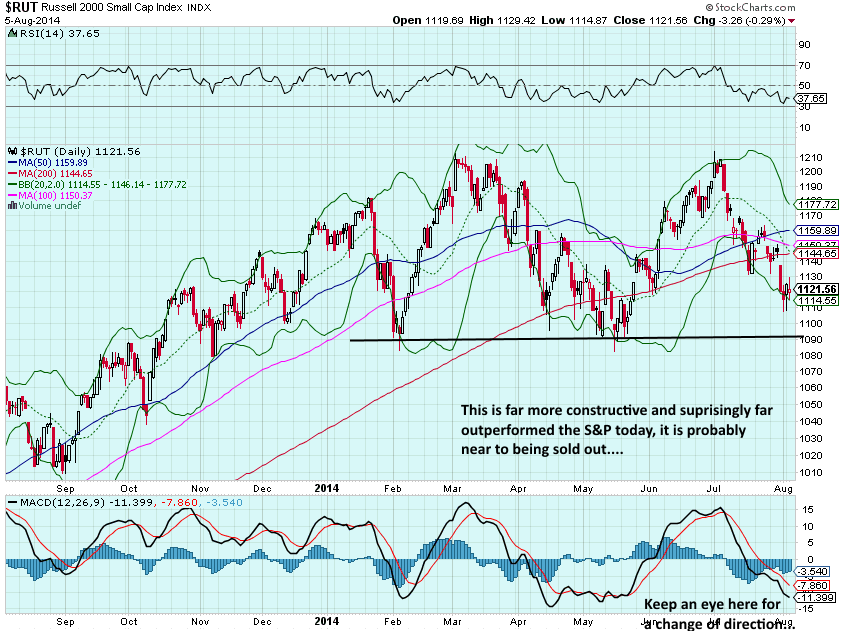
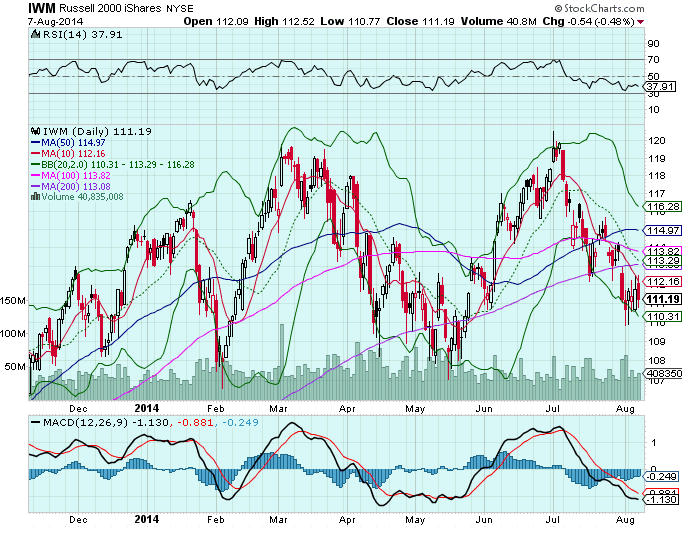
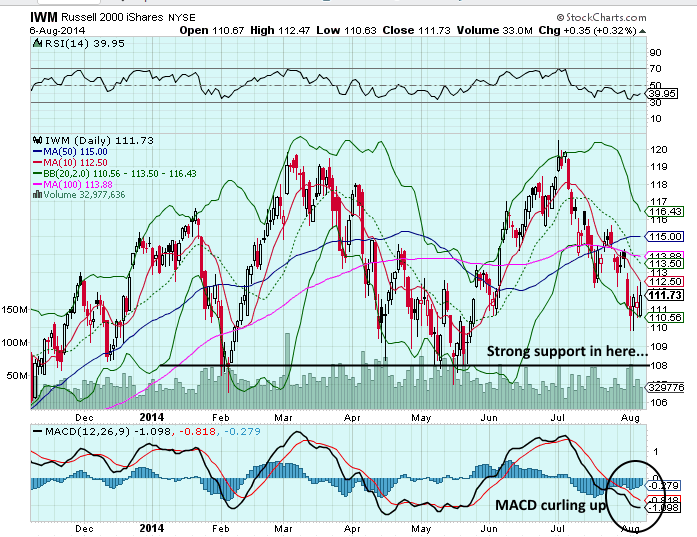
The small-cap index, the leader to the downside and the demonstrator of the breadth divergence we have been seeing lately, wanted to go positive today. It certainly appears that the selling in this area is nearly over.

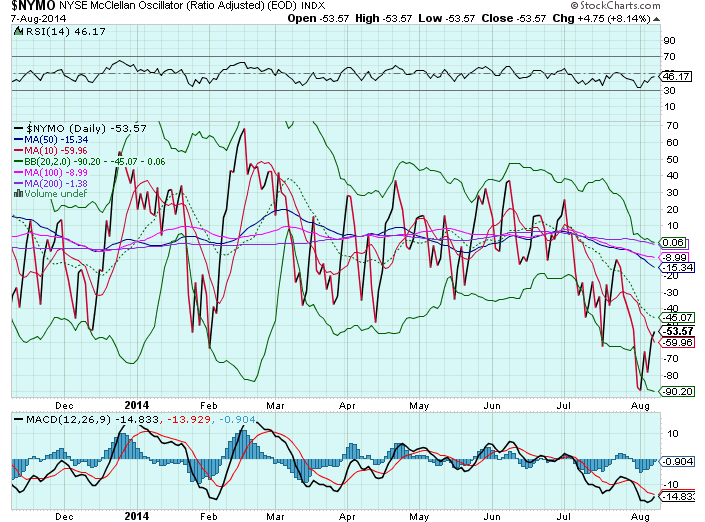
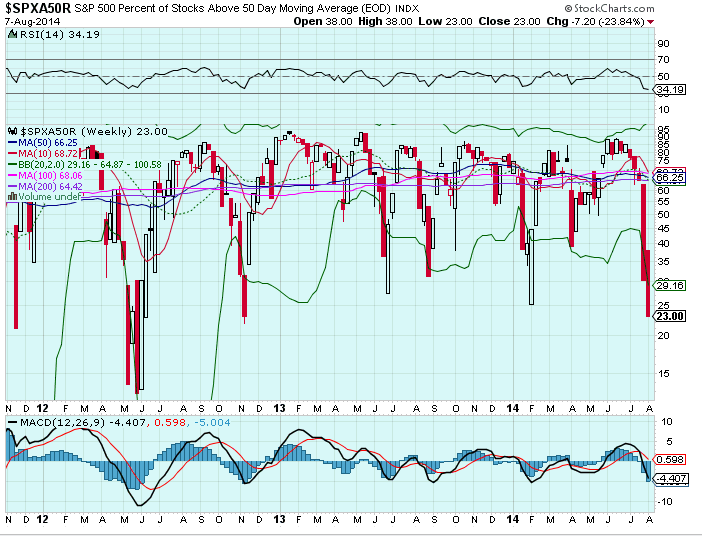
Consider the NYMO, the CPCI, and the percentage of stocks trading below their 20 and 50 day moving averages, and we are probably closer to the end than the beginning of this mini-correction. Take advantage of it while it lasts…

To subscribe to the weekly Volatility Analytics newsletter including real time trade alerts, click the link in the above menu.

Breaking Down Yesterday’s VIX Spike

Posted by Scott Murray on August 1, 2014
Posted in: Uncategorized. Tagged: VIX, VXX.

Today saw four month highs in the VIX, the S&P 500 gauge of implied volatility. Generally, sudden demand for puts and an absence of put sellers generates swift spikes up in the VIX, and today’s demand for puts was at a ratio of 2.6 to 1, with the largest percentage of puts being hit at the asking price.

spypc731

The punditry is scrambling for an explanation, and Argentinian default is a reach at best. It appeared to me that the dip buyers finally dried up and gravity took over taking out the stops. In reality, today’s not that big of a deal after months of methodically plodding higher.

Let’s look at the VIX, VIX futures, and the VXX for immediate opportunities. First the VIX chart for 2014, demonstrating just how long it has been since the VIX has seen 17:

vix731

It certainly appears that the VIX is nearing resistance levels, but the VXST (9 day rolling VIX index) is significantly higher:

vxst731

Meanwhile the VIX August future, which settles in a little under 3 weeks on August 20th, is not buying the move:

vx731

So you now have a backwardation from the VXST, to the VIX, to the VIX future. This means that S&P 500 implied volatility is highest in the nearest term. The translation of the shape of this curve is that investors are not looking for a prolonged sell-off. They are demanding weekly puts at a higher rate than they are looking for longer-term protection. Who can blame them? Every VIX spike has been a great volatility and premium selling opportunity, and put owners and short sellers have been burned over and over again. It is going to probably take a breach of the 100 day moving average on the SPX to get people thinking that something is really going on other than a buyable dip. Here is a look at the VIX futures term structure:

vixterm730

Courtesy Vixcentral.com

If you’re in the camp that this is just a temporary sell-off, then the VXX and UVXY offer some terrific ways to capitalize quickly on a fade in volatility, and I cover these every week in my subscriber newsletter. These ETFs can be tough to borrow to outright short, since the gig is up on these things as perennial value destroyers. I prefer to use the options as they are frequently mispriced, and that is exacerbated the farther out in time you go.

Today I sold the UVXY $50 September calls for $2.40-2.65. Take a look at the chart of this option:

vxx50731
This option has fallen from $20 to $2.76 in 3 months, and it was only $1 yesterday. For this option to be in the money, the August and September VIX futures (the current UVXY holdings) would have to rise another 30% and remain there until the third week of September. The odds of that are quite slim as the September future would have to sit above 20. VIX futures have failed to sustain that price level for any significant amount of time since the spring of 2012.

You can take a longer-term approach by selling the VXX January $40 call. Again, you would need to see the effect of contango in the VXX disappear for stretches of time for that to happen, along with elevated futures prices. That option was up $1 today, so it wouldn’t be surprising to see that come back out of the price in a short period of time. Look even farther out to January of 2016 if you want to sell some calls and do very little position maintenance.

Of course, shorting these ETFs for the long haul will always work depending on your time frame. It’s only a matter of when, not if, the next reverse split arrives.

May 27th Newsletter Released

Posted by Scott Murray on May 28, 2014
Posted in: Uncategorized.

New analysis this week on:

Historical VIXs from 2004-2008, May-June of 2013, how today’s volatility range measures up and what to expect

SPY and other indexes implied volatility

Oil and gold volatility

VXX components and the futures term structure

Technical charts, VIX futures charts

Trade set-ups

Subscribers get real-time trade alerts and volatility updates.

Chart of the day:

2014-05-28 11_34_25-$TNX - SharpCharts Workbench - StockCharts.com tnx528

To subscribe, click the link in the above menu. The newsletter is released weekly on Tuesday evenings. A sample is provided in the menu link.

Seeking Alpha Post

Posted by Scott Murray on May 19, 2014
Posted in: Uncategorized. Tagged: VIX, Volatility, VXX.

Instead of posting here, I put up an article on Seeking Alpha today:

http://seekingalpha.com/article/2226103-will-vix-expiration-bring-any-surprises


VIX Ticks Higher – SPY Options Demonstrate Fearless Behavior

Posted by Scott Murray on May 15, 2014
Posted in: Uncategorized. Tagged: spy options, uvxy, VIX, Volatility, VXX.

I want to thank all the subscribers that have signed up for the newsletter and trade alerts. All of the trades in Tuesday’s installment are working, and I hope you have taken advantage of the trade alerts as well.

Even I expected a larger move in the VIX today when the S&P was down 25 points, but here is why it didn’t:

spystats515

These are the stats for the SPY options today. When the SPY was getting nailed, folks SOLD puts and bought calls. More puts were sold than bought and more calls were bought than sold. That is a recipe for a lower VIX, without a doubt. This implies that no one believes that the S&P 500 can actually fall more than a certain amount before dip buyers will arrive. And you can’t blame them, that intraday buy-the-dip trade has seen it’s share of stick saves of late, which are often accompanied by a gap up the next day. When someone else has your back, why worry about selling the tiniest of volatility premium when it shows up?

But when something gets too easy in the markets, eventually it gets taken away or at least burns a bunch of folks to teach them a lesson. Selling puts like this can be hazardous to your health, maybe not today or tomorrow, but it will catch up to you eventually.

I highlighted in the newsletter that the SPY was technically setting up for a down move, and today it arrived. What  happens when there is very little volatility in the options and the index makes a 1% move? This:

spychain515

This doesn’t even tell the whole story frankly. If you timed a near-the-money SPY put right today, you could easily have made 400%, instead of the 225% seen at the close. Here is a 5 minute chart of the weekly 187 SPY put:

spy187Actually, if you bought it at the open, you could have made 500%. That is what happens when there is no juice in the options. So, while the market is underpricing volatility, that doesn’t mean that you can’t own it in other ways, and this is a prime example. This is a long vol trade without using VXX or VIX.

We may have more trade and volatility email alerts tomorrow, if you are interested, the newsletter link is in the above menu.

Volatility Analytics Sample Newsletter

Posted by Scott Murray on May 9, 2014
Posted in: Uncategorized.

Tuesday evening I will publish the first Volatility Analytics newsletter. A link to a sample is below. I’m sure it will change and improve over time, and your feedback is very welcome on not only what you want to see, but how it can be improved.

I will be emailing volatility updates, probably more often when volatility hits extremes. Also, I will email subscribers shortly after I put on trades or see asymmetric risk/reward opportunities.

If you like what you read, the link to subscribe is in the menu above.
Link to sample:
https://drive.google.com/file/d/0B-D5AKivENQTVzZ0ZHowNGZ3bFU/edit?usp=sharing


Sharp Reversal Fails to Ignite the VIX

Posted by Scott Murray on May 8, 2014
Posted in: Uncategorized. Tagged: uvxy, VIX, VXX.

You would think, and I apparently am the only one with this thought, that the convergence of a declining 10 day moving average with a rapidly approaching 50 day would get some folks prepared for a possible downside moving in equities. Not so. The implied volatility in S&P puts is incredibly low:

2014-05-08 18_44_42-Main@thinkorswim [build 1860.10]

Look at the implied volatility on the puts, if this doesn’t amaze you, I don’t know what to say. The S&P 500 falls 20 points from the high of the day, and what did people do? They SOLD puts. They have become so brazen, that they aren’t buying them, they are sellers. Look at the call side, the implied vol going out weeks is higher on the CALL side. All this happened on this kind of price action:

2014-05-08 18_51_55-SPY - Quick Chart Main@thinkorswim [build 1860.10]

The energy sector has been a leader lately, and look what it did today:

2014-05-08 18_59_30-XLE - SharpCharts Workbench - StockCharts.com

The saving grace for the market today, was the financial sector. The recent leaders, utilities and energy reversed, and higher yields helped out the banks:

2014-05-08 19_02_16-Google Finance_ Track your portfolio & the market for free

But if folks expect the financials to carry the baton from here, the bounce ran out of steam as the 50 rejected the XLF after two strong days:

2014-05-08 19_04_19-XLF - SharpCharts Workbench - StockCharts.com

The recipe is there for a rude awakening. Will it happen? The crowd has voted emphatically that the answer is no.

I added to May 30th VXX $38 calls today.

(I will be starting a volatility newsletter shortly for $25/mo. It will include my perspective on the volatility indexes, trading ideas, VXX analysis, and volatility forecasting using proprietary models. Real-time email trade alerts and volatility email updates will be included. The sample will be available by the end of the week and it will go out on Tuesday nights. Email me at scottmurray1 (at) gmail.com if you are interested.)

Posts navigation

← Older Entries
Newer Entries →
  • Subscribe to the VA Newsletter – $30/mo

  • Follow us on Twitter

    Follow @VolatilityWiz
  • RSS Volatility Analytics RSS Feed

    • Volatility Analytics Newsletter Samples
  • Recent Posts

    • Volatility Analytics Newsletter Samples
    • Summer Volatility – Will it Vanish?
    • Creative Volatility Trading (Part 1) – Calendar Ratio Spreads
    • Trading Volatility in a Low Vol Market
    • How Much Short-Term Downside is Left in VXX and UVXY?
  • Archives

    • May 2021
    • May 2018
    • May 2017
    • April 2017
    • November 2015
    • August 2014
    • May 2014
    • March 2014
    • November 2013
    • October 2013
    • September 2013
    • August 2013
    • July 2013
    • June 2013
    • May 2013
    • April 2013
    • March 2013
    • February 2013
    • January 2013
    • December 2012
    • November 2012
  • RSS VIX and More Blog

    • The Latest on VXX and Additional Creation Unit Suspensions by Barclays
    • SPX Weekly Options Will Soon Be Available with Expirations Every Day of the Week
    • UVXY Dominates VIX ETPs By Dollar-Weighted Volume
  • Categories

    • Uncategorized
Proudly powered by WordPress Theme: Parament by Automattic.