Being short volatility has been an easy trade this year, and it may be that folks are not aware of the potential risks of holding short vol positions when the VIX is trading at levels not seen in 7 years. So, since this week was incredibly quiet on the volatility and market front, let’s take a quick look at what can occur if you are short volatility at very low levels.
For starters, people are getting very bullish; I have been hearing a lot of people justifying that folks should get invested right here at an all-time high. This is a powerful force, chasing higher prices, and this time of year, it sucks a lot of people in. So, seasonality of the markets should be considered:
This chart should really bring it home. Market tops frequently occur in April and can often hold that top well into the fall. The market has been hammered the last three springs, and this is not a recent trend. The best six months for investors historically are November to April, and if that is all you did in your life, you would be a big winner. Since 1950, investing in this fashion returned 6700%, while investing from May to October returned -10%.
May is one of the worst months of the year for the stock market, ranking #9 in the Dow and #8 in the S&P. As I highlighted the other day, when there is no down month in the year before May, the month of May has an even poorer record. Thus, we are buying incredibly low implied volatility in May and June.
Secondly, since folks are beginning believe that vol is going to be low forever, since we are in a 1990’s type bull market, I submit a couple pieces of data:
This is not the 1990’s, not even close. The last time we had an up May without a down month during the year, the GDP for the second quarter was 7.1%.
How about corporate profits? Since people keep claiming that forward P/E for the market makes the current market reasonably priced. Corporate profits as a percentage of GDP:
This chart is simply amazing. Warren Buffett said in 1999:
“In my opinion, you have to be wildly optimistic to believe that corporate profits as a percent of GDP can, for any sustained period, hold much above 6%… Maybe you’d like to argue a different case. Fair enough. But give me your assumptions. The Tinker Bell approach – clap if you believe – just won’t cut it.”
And:
“when people forget that corporate profits are unlikely to grow faster than 6% per year, they tend to get into trouble.”
Lastly, lets look at volatility complacency. From FT’s alphaville:
To explain what Pokies may be going on we reached out to one of the best volatility analysts in the business, Christopher Cole at Artemis Capital Management. He offered us some thoughts by email.
Cole, via our inbox (our emphasis):
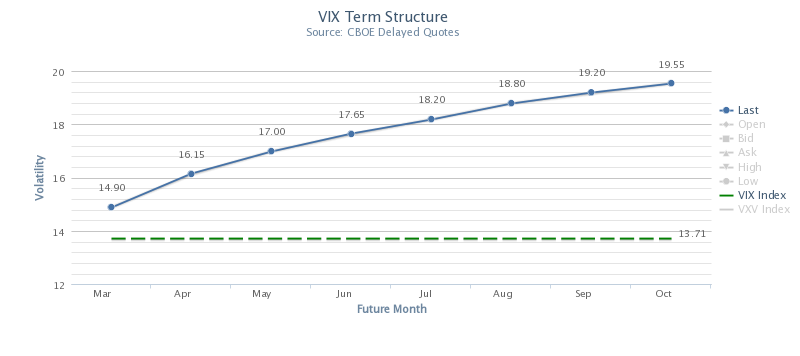
The behavior of the front of the VIX futures curve indicates that traders and investors have bought into the hope we have entered into a new low-volatility regime and that central banks will succeed in limiting all tail risks.
2012 was one of the best years for volatility short sellers since 2006.
The back of the curve continues to be dominated by longer-term fears and institutions unwillingness to supply vega to the market but the short continues to get pounded down any time the VIX ticks up. For me – I remain very skeptical.
There are a lot of “vol tourists” today.
In a yield hungry world you have a lot of people turning to the easy trade of shorting front month volatility in a believe that the Fed will always have their back. A lot of these players don’t truly understand the asset class but nonetheless are overconfident based on the recent performance and simplicity of directional short bets in vol using simplistic VIX ETNs.
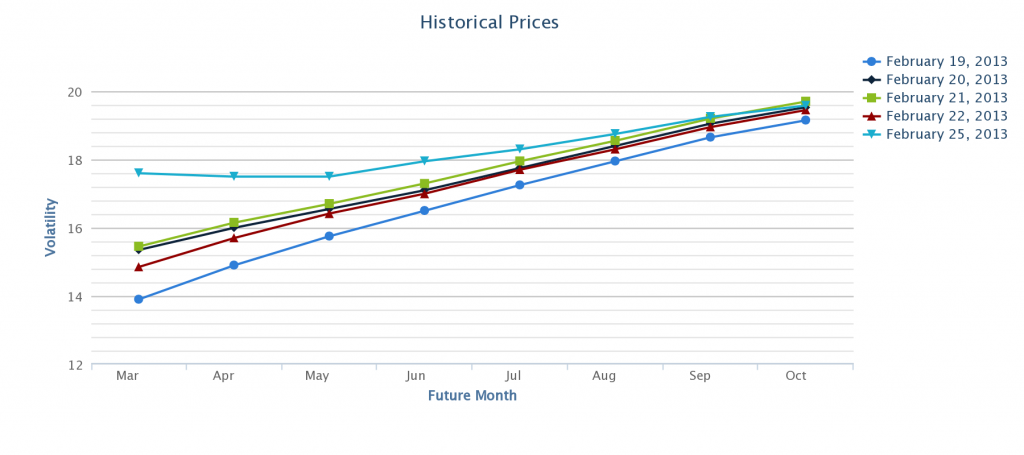
A powerful convexity is being built into short term volatility futures due to excessive programmatic shorting, levered ETNs, and these ‘vol tourists’.This convexity and vol-of-vol was on full display yesterday.
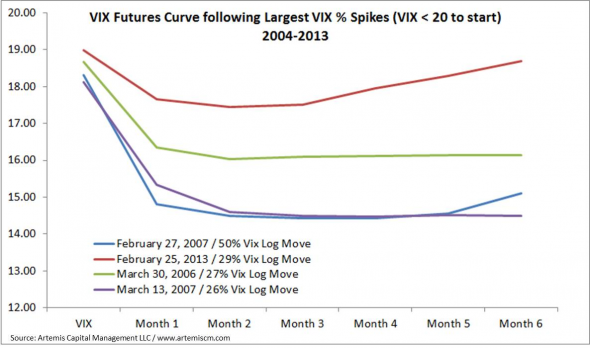
If 2013 begins to look anything like 2007,2010, or 2011 given the recent expectations of the VIX futures markets these ‘vol tourists’ are in for a nasty surprise. As for this being unique… hardly… people have a very short memory (or they don’t do their homework). Below is a chart showing the shape of the VIX futures curve following the largest log VIX spikes since 2004 when the VIX was <20. Yes… this VIX futures curve shape is unique for 2010-2012… but it resembles the performance of the futures following VIX jumps in the pre-crisis era.
In other words, shorting Vix has been a hugely successful trade post-crisis because of a general belief that real volatility will always be absorbed by the state, so there is no real risk associated with collecting premiums from selling short-term volatility.
Source:
http://ftalphaville.ft.com/2013/02/26/1400212/a-powerful-convexity-in-short-term-vix-futures/?
Conclusion:
My take on this is simple. I like probabilities. The greater probability is that the market will experience lower prices and higher volatility at some point over the next few months. Implied volatility on index puts are incredibly cheap. Buying volatility products in general is a loser. Get some vol where its very fairly priced and be wary of being short volatility. We may get a great April and May in the markets, but history makes a solid argument for the other view.


