Volatility has been on vacation for the last 10 trading days; doesn’t it seem like longer than that? This seems to be a good time to evaluate the volatility landscape from a forward perspective and prepare for what could be profitable positioning using volatility products.
While the VIX has remained at low levels for long periods of time in the past, let’s be clear about a few things. First, 13 is not a level that even in quiet times is sustainable for long periods. The standard deviation of markets will not remain low forever. Let’s examine the S&P 500 this month.
With the S&P up over 3% this month, and the VIX implying a one standard deviation move of 3.75% in 30 days, we are at the threshold of crossing a one standard deviation event in just 10 trading days alone. Short term historic volatility is higher than the VIX is implying going forward. Most of the pundits will claim that the VIX predicts future volatility, but those with common sense will tell you that this is nonsense. A low VIX is no guarantee of anything, frankly. If you knew that you were going to be in a car accident, you would not have driven that day, right? No one sees most market volatility coming. If anything, a low VIX is reflective of the recent past, not the future.
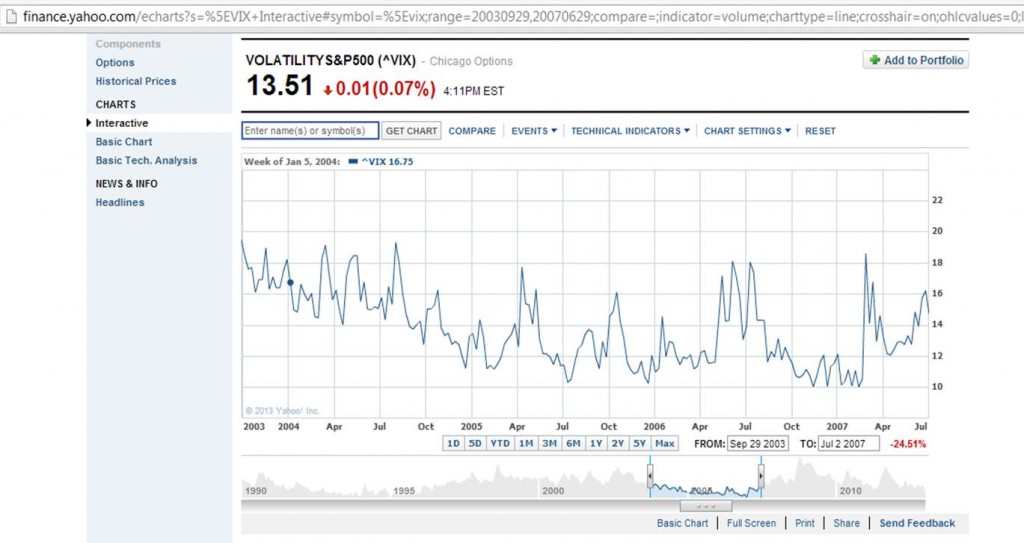
Second, even in historically quiet bull markets, the VIX did not remain at 13. From October of 2003 to June of 2007, the VIX did not cross 20. Yet it spiked, as you can see below, to and above 18 on many occasions. So, 13% is fleeting, it always will be.
In 2012, the VIX closed below 14 only 4 times. This was in a year that experienced equity returns on the S&P of over 10% and a VIX that spent very little time over 20. So you can see how difficult it is for this statistic to remain at these levels.
Clearly we have a political event ramping up. The VIX futures are indicating that there may be event risk on the horizon:
| Symbol | Contract | Month | Time | Last | Change | Open | High | Low |
|---|---|---|---|---|---|---|---|---|
| VX F3-CF | S&P 500 VOLATILITY | January2013 | 16:44:46 | 14.20 | 0.10 | 14.25 | 14.40 | 13.90 |
| VX G3-CF | S&P 500 VOLATILITY | February2013 | 16:44:46 | 15.80 | -0.19 | 16.10 | 16.20 | 15.70 |
| VX H3-CF | S&P 500 VOLATILITY | March2013 | 16:44:46 | 17.25 | -0.11 | 17.55 | 17.60 | 17.13 |
| VX J3-CF | S&P 500 VOLATILITY | April2013 | 16:44:46 | 18.15 | -0.05 | 18.32 | 18.32 | 17.95 |
| VX K3-CF | S&P 500 VOLATILITY | May2013 | 16:44:46 | 18.90 | 0.08 | 18.99 | 19.00 | 18.60 |
| VX M3-CF | S&P 500 VOLATILITY | June2013 | 16:44:45 | 19.55 | -0.02 | 19.60 | 19.60 | 19.25 |
| VX N3-CF | S&P 500 VOLATILITY | July2013 | 16:44:45 | 20.30 | -0.02 | 20.35 | 20.35 | 19.95 |
| VX Q3-CF | S&P 500 VOLATILITY | August2013 | 16:14:59 | 20.80 | -0.05 | 20.85 | 20.85 | 20.55 |
Yet the VIX term structure is not yet indicating much of a move over the same period:
| Trade Date | Expiration Date | VIX | Contract Month |
| 1/15/2013 2:59:43 PM | 13.49 | 1 | |
| 1/15/2013 2:59:43 PM | 15.20 | 2 | |
| 1/15/2013 2:59:43 PM | 16.28 | 3 | |
| 1/15/2013 2:59:43 PM | 17.40 | 4 |
The spread between the VIX futures and the VIX term structure is a whopping 235 basis points. One of these will change, that is for certain. My guess is that we gravitate higher, as an unforeseen event, a short-term market top, or political wrangling over the debt ceiling bring the hedgers and traders back from their sabbatical.
Because the VIX is so low, better trades can be structured using certain straight puts on stocks and indexes. Look around for cheap implied volatility, and purchase it far enough out to prevent short-term theta burn. I’m looking for one more move higher in the S&P before I get long a basket of puts. Yet, it is time to get that list ready, as earnings seasons have a tendency to mark short-term tops.
Trade Action:
Long VIX March $14 calls for $3.50 @ 1:33 PM