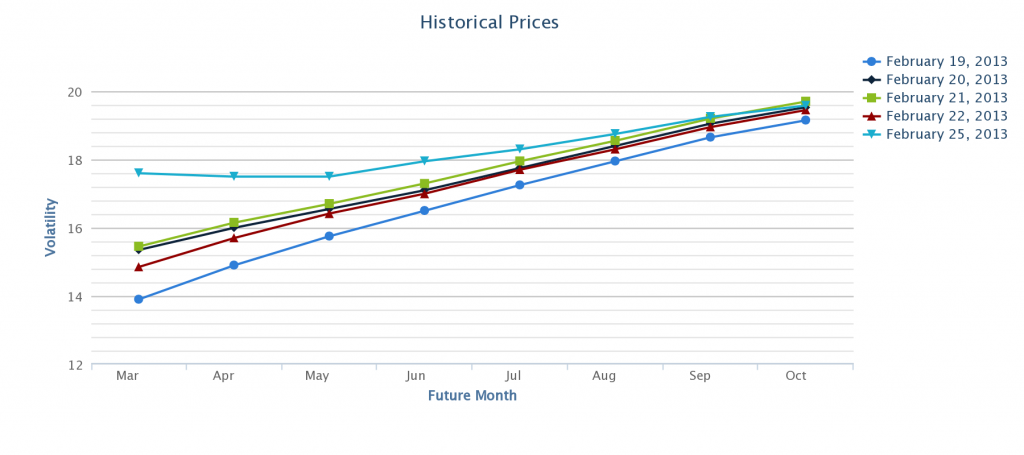
Here is what the VIX futures curve looked like on February 19th when the VIX front month future hit the second lowest level of 2013 (13.90) along with the curve over the next four trading days:
Here is what the VIX futures curve looked like on January 23rd when the VIX front month future hit the lowest level of 2013 (13.70) along with the curve over the next five trading days:
Here are the futures today:
| VX J3-CF | S&P 500 VOLATILITY | April2013 | 16:07:22 | 14.15 | -0.40 | 14.55 | 14.60 | 14.15 |
| VX K3-CF | S&P 500 VOLATILITY | May2013 | 16:07:25 | 15.45 | -0.35 | 15.75 | 15.78 | 15.40 |
| VX M3-CF | S&P 500 VOLATILITY | June2013 | 16:07:16 | 16.37 | -0.33 | 16.65 | 16.70 | 16.25 |
| VX N3-CF | S&P 500 VOLATILITY | July2013 | 16:07:01 | 17.15 | -0.20 | 17.32 | 17.35 | 17.02 |
Charts courtesy of VixCentral.com
And the VIX term structure (NOT the futures, the actual VIX formula values over points in time):
VIX Volatility Index values generated at:Â Â 03/26/2013 14:58:17
| Trade Date | Expiration Date | VIX | Contract Month |
| 3/26/2013 2:58:17 PM | 12.37 | 1 | |
| 3/26/2013 2:58:17 PM | 13.47 | 2 | |
| 3/26/2013 2:58:17 PM | 14.58 | 3 |
I don’t know what everyone else is thinking, but I want exposure to May’s low implied volatility. But I don’t want to pay exorbitant premiums. Heck, I already own VXX calls, and I hate owning those, but they were cheaper than VIX options when I bought them, today they are at pretty much parity. The VIX option at 14 is $1.20 and with the VIX 14 future trading at 14.15, the VXX ATM call is 1.28. The VIX options are now cheaper, but the VXX gives you 3 days longer until expiration.
Anyway, with all the decay occurring with the holiday and the possibility of benign markets to begin the month, not to mention April’s historical market history, I wanted to be bearish without being eaten alive by contango and time decay, yet can capitalize whenever the inevitable downside comes. Thus the IWM calendar:
Short April 5th IWM 93 put for .60
Long May IWM 96 put for $3.30
The IWM was lagging the other indices today. I will have the opportunity to carve out some more of the cost of May after next week should I so choose, but should markets begin to descend, that would work also. The April jobs report miss triggered a market downturn in early April of 2012, and that is on tap for next Friday.
I will be adding more May volatility next week if the markets continue higher. The “money on the sidelines” talk is omnipresent again, yet no one quantifies that and seems to use this fairy tale to convince themselves that there’s a greater sucker to buy after a prolonged and unpaused rally. Break out the history books, even the best years have significant market drops.
May is generally only kind to investors when there have been down months preceding it. This is the key that no one seems to understand. In 2010, the market rose 10.5% from Feb to Apr until May put an abrupt stop to that with at -8.2% month. Aprils frequently represent tops in the market for several months. This was true for 2012, 2011, 2010, and many other years.
There has not been a positive May without a down month in the S&P preceding it that same year since…..1996. And the market was only up 5% heading into that May. It also occurred in 1995, but the S&P was up 34% that year following a down year in the S&P. This market is going down for a pause soon, it is just a matter of time. And May is what usually does the trick. This is one of the few street adages that is actually supported by a lot of historical and cyclical economic data.
Trade/Action:
The IWM put calendar is a phenomenal risk/reward trade for many reasons:
A .You are able to sell any IWM equal or lower strike put against your long position for the entire time you hold the long May put without using margin. Thus, every week for 7 weeks you can chip away at the cost of the long leg until it is essentially free. Because IWM weeklies are offered for at least 5 consecutive weeks out, you have a ton of flexibility and opportunity.
B. The market risk here is to the downside as opposed to the upside.
C. You get an implied volatility in your long leg of 13.2%, yet you know that this has a higher beta than the S&P 500 that is pricing May volatility at around 13.5%.This is a bargain.
D. If the market goes higher, you can set another calendar at a higher level and create a double calendar that improves your probability of a winning trade. See Dan Sheridan for more on this topic.

