As usual, if you watch CNBC or read the financial press, you were told that volatility was “here to stay”. Of course, it was not and the VXX is the perfect vehicle for taking advantage of periodic spikes in volatility. I can honestly say, that if I didn’t have to fulfill personal obligations out of town on Friday, I would have ridden it lower, but let’s be real. 100% and 50% gains over a few days are not to be sneezed at, especially when you’re in a position where it is tough to lose, and that is what the VXX provides you when the futures get out of whack with reality.
The VIX is more a reflection of past volatility than future volatility most of the time, and that is a point that most people do not understand. The VIX also has predictable patterns, and July could not have played out history any better. Remember this chart?
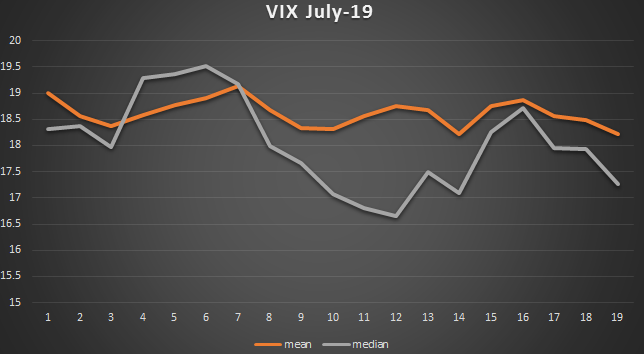
This is our proprietary volatility wave, a predictor of monthly volatility. It is far from perfect, but it is a very useful tool. This is day 10, and as you can see, we are near the volatility trough for the month. The question is, what is there to do now?
The VXX can certainly fall further in the near-term, but let’s look at the futures term structure:
| Symbol | Contract | Month | Time | Last | Change | Open | High | Low |
|---|---|---|---|---|---|---|---|---|
| VX N3-CF | S&P 500 VOLATILITY | July2013 | 16:14:59 | 15.35 | -0.60 | 15.70 | 15.70 | 15.25 |
| VX Q3-CF | S&P 500 VOLATILITY | August2013 | 16:14:59 | 16.70 | -0.75 | 17.25 | 17.30 | 16.70 |
| VX U3-CF | S&P 500 VOLATILITY | September2013 | 16:15:00 | 17.85 | -0.90 | 18.50 | 18.50 | 17.80 |
The VXX is holding almost 25% July and 75% August, as the VIX futures expire next Tuesday. Therefore, the majority of the VXX move is reliant upon the August contract for the next few weeks. VXX contango is heavy at 8.7% or roughly 8 cents per day. If you want to get long VXX, you probably want to see the the August future fall to 16 or below to have a fighting chance Pokies. Buying calendar call spreads selling the $18 this week and next against the July 26th may get you a free rider on some calls if vol remains low until July 20th. I am eyeing this as a potential trade.
Oil volatility is relatively high, so put spreads on UCO forJuly/August are compelling ideas. A $32 calendar put spread is roughly .75, and could pay 2-4x, if oil falls below $100. I was too early on the July puts, but added to August $31 puts for .85 today, so my cost is now .93. If oil falls in the next few days, I will sell Julys against this position to hopefully get a nice cheap rider into what has been a tough month for oil the last five years, August. We got an almost uncanny identical spike in crude last year around this time, only to see it fall swiftly afterward:
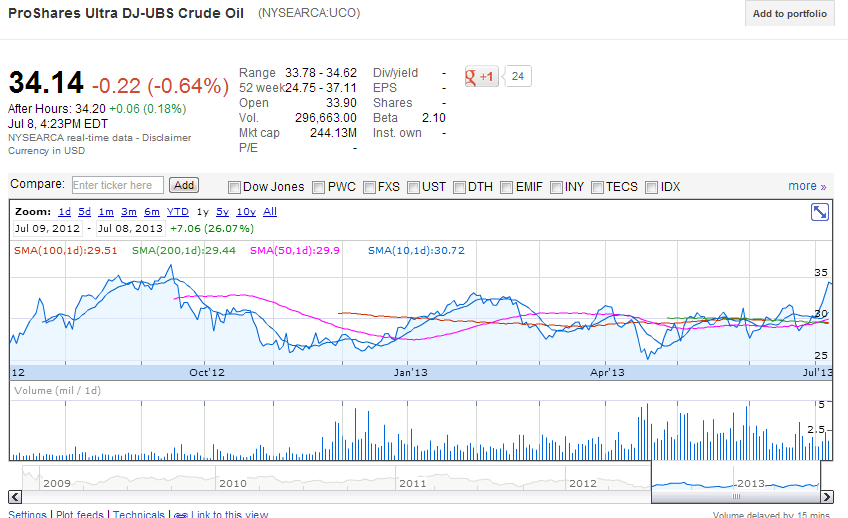
Oil is great at quickly derailing itself by causing economic damage at the pump and political pressure on several parties to address high prices, so it always seems to come back to reality eventually. With global economic growth so anemic and the dollar in an uptrend, it is reasonable to expect a significant retracement of this spike at some point in the next two months. It also has a tendency to take a beating when the market sells off. So, it has multiple headwinds. Furthermore, the commitment of traders is ridiculously long:

Managed money is 10-1 long, and retail is 1.5-1 long, so any unwind could be a herding exercise.
I am also eyeing a weekly GLD spread sale, potentially on both the call and put side, an iron condor. Additionally, I am preparing for earnings season, where using calendars to arb implied volatility is a terrific way to get asymmetric risk/reward set-ups.
Follow @VolatilityWiz on twitter and stocktwits for real-time trading ideas. A subscription service is in the offing; if you are interested in receiving information on this in the near future, shoot me an email using the contact link above.