New analysis this week on:
Historical VIXs from 2004-2008, May-June of 2013, how today’s volatility range measures up and what to expect
SPY and other indexes implied volatility
Oil and gold volatility
VXX components and the futures term structure
Technical charts, VIX futures charts
Trade set-ups
Subscribers get real-time trade alerts and volatility updates.
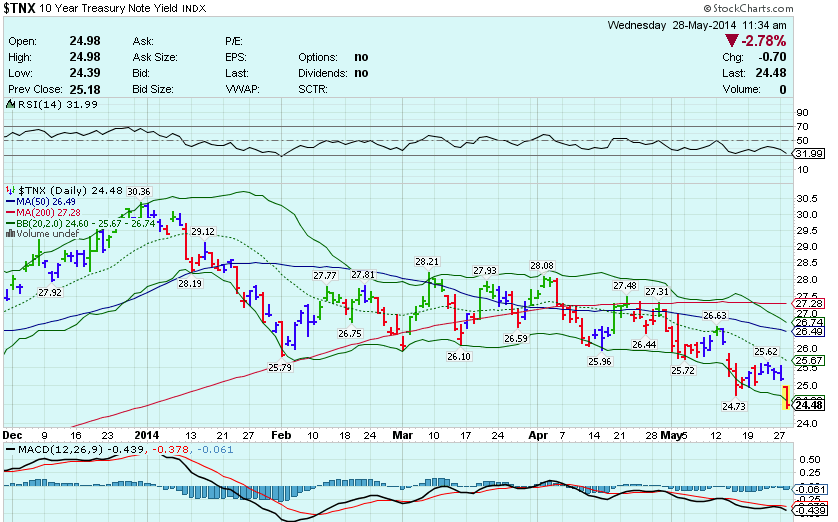
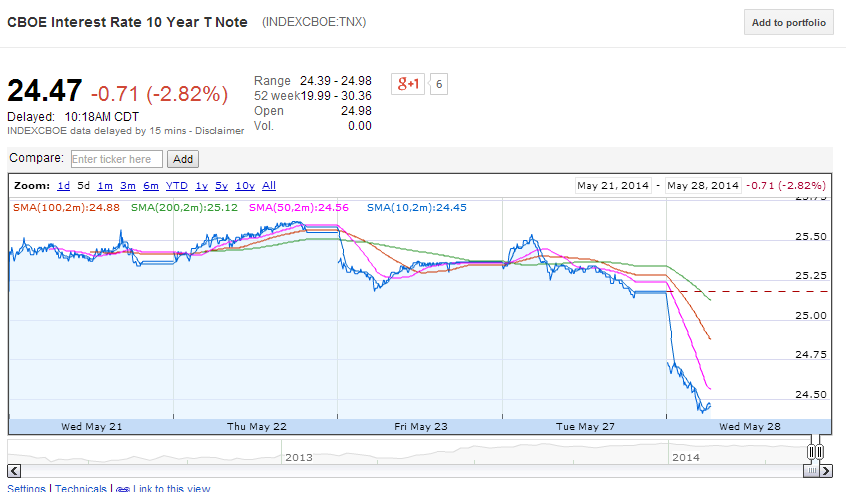
Chart of the day:
To subscribe, click the link in the above menu. The newsletter is released weekly on Tuesday evenings. A sample is provided in the menu link.

