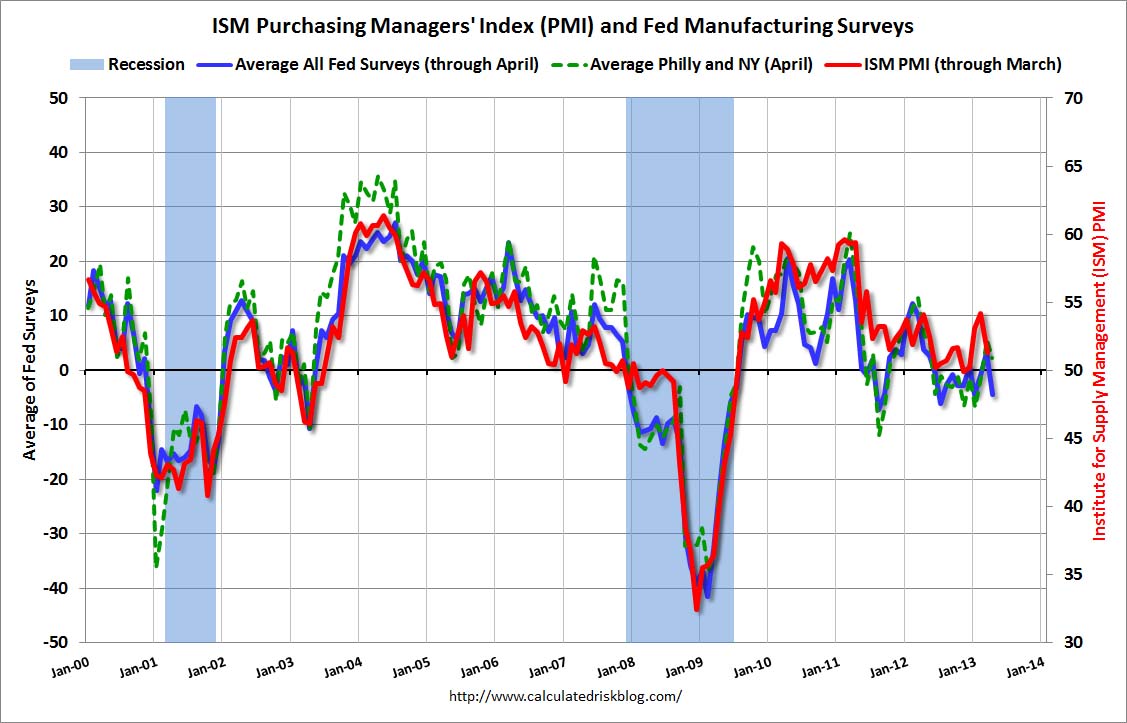
Today was an odd day. We got mixed data points, including an absolutely horrible Dallas Fed manufacturing index number that was so bad that I couldn’t find a lower number going back though 2011. Check out this chart:

So it certainly appears that the regional manufacturing indexes are signaling that the ISM may hit 50 this week. Should cause a rally in stocks, right? On a brighter note, pending home sales were up 7% over last year. You would hope that someone out there is interested in taking out a loan when the cost of using the money is barely above inflation. People don’t realize that a loan can become an asset if rates increase.
Banks just told everyone two weeks ago that refis are winding down and new lending will need to increase to fill up the earnings gap. Furthermore, businesses are not borrowing, they are pulling back and hoarding cash again due to weak demand:
http://online.wsj.com/article/SB10001424127887324743704578443130749674850.html
This is the odd thing about the market these days, it appears to care very little about the economic environment. What about earnings?

Sort of an odd situation here. Earnings estimates were low-balled thus 70% of companies are beating, while revenues are declining. I don’t really know what to make of this, or how it portends to the next few quarters of earnings, while expectations are fairly high for the second half.
April tends to be strong for equities at the outset, weak in the middle of the month, and strong right here into the first couple days in May. Then, the market will be dealing with the push-pull of economic data versus global central bank policies. Folks seem to believe that the Eurozone will cut. But if the ECB cuts rates, that could be a headwind to stocks as the dollar should rise. That again translates to lower earnings next quarter as well.
It is going to get interesting to say the least. The volume on the SPY was the lowest since Christmas Eve today, save for two days in February. That is amazing. It’s as if the market is levitating higher and no one wants a part of it. Besides central bank activity, we have jobs and ISM numbers out this week.
The VIX is asleep ahead of all this:
VIX Futures:
| Symbol | Contract | Month | Time | Last | Change | Open | High | Low |
|---|---|---|---|---|---|---|---|---|
| VX K3-CF | S&P 500 VOLATILITY | May2013 | 16:44:52 | 14.75 | -0.05 | 14.60 | 14.85 | 14.45 |
| VX M3-CF | S&P 500 VOLATILITY | June2013 | 16:44:51 | 15.55 | -0.07 | 15.43 | 15.55 | 15.15 |
| VX N3-CF | S&P 500 VOLATILITY | July2013 | 16:44:51 | 16.30 | -0.08 | 16.25 | 16.35 |
VIX Term Structure of SPX options, not futures:
| Trade Date | Expiration Date | VIX | Contract Month |
| 4/29/2013 3:14:57 PM | 13.28 | 1 | |
| 4/29/2013 3:14:57 PM | 13.96 | 2 | |
| 4/29/2013 3:14:57 PM | 14.58 | 3 | |
Outlook/Action:
Added a few SPY puts late last week for June. The implied vol on these make them a bargain. Closely eyeing some bear call spreads, like in XLE for example. Oil has not had a good summer for quite a while, and the sector is making another lower high right here.
We will be adding a real-time email subscriber service soon at a very affordable price, still to be determined, but under $60/month. If you are interested in receiving an email concerning this service, contact me at scott.murray1@gmail.com.