The VIX touched nearly 22 before falling intraday to 18.60 as the S&P bounced off 1560, a 30 point drop. The markets then faded into the close and the VIX reclaimed 20. The VXX was much more behaved, as the futures held below spot and then opened up a spread to spot before closing in line. The VXX is actually far less volatile than the VIX:
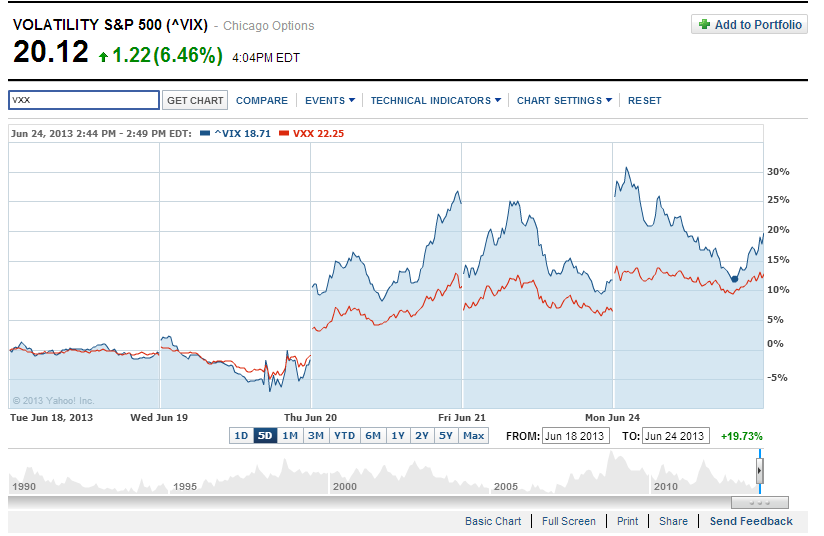
This chart demonstrates how the much tighter the VXX range was than the VIX. And the futures are the reason, they did not fluctuate like the VIX did today:
| Symbol | Contract | Month | Time | Last | Change | Open | High | Low |
|---|---|---|---|---|---|---|---|---|
| VX N3-CF | S&P 500 VOLATILITY | July2013 | 16:21:54 | 20.15 | 1.15 | 19.75 | 20.35 | 19.35 |
| VX Q3-CF | S&P 500 VOLATILITY | August2013 | 16:22:07 | 20.30 | 0.90 | 19.90 | 20.48 | 19.78 |
| VX U3-CF | S&P 500 VOLATILITY | September2013 | 16:15:00 | 20.80 | 0.90 | 20.40 | 20.85 | 20.25 |
The S&P would seem to have two major support areas, the 200 day moving average at 1506, and 1550, where it spent several weeks in consolidation:
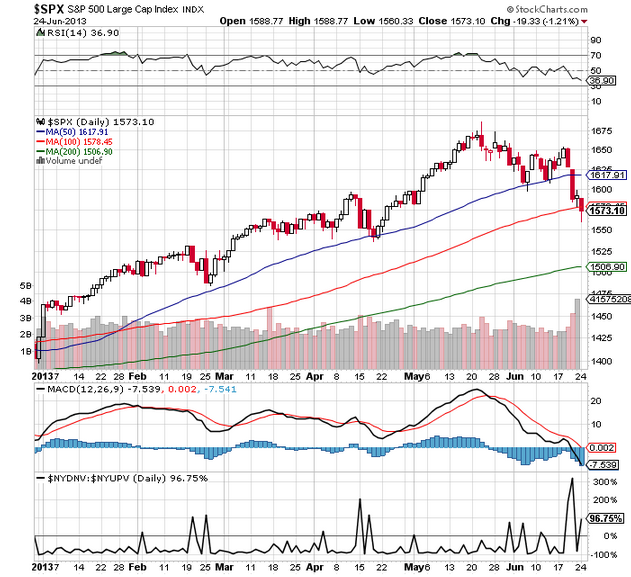
Courtesy of stockcharts.com
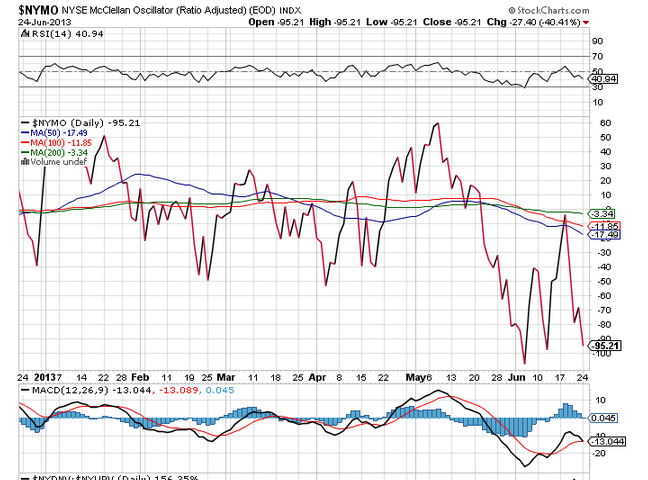
And no one should be shocked that the oscillators sit near the lowest points off the the last year:
As I’ve pointed out several times, June is one of the worst months for stocks (#11 Dow, #10 S&P), yet July is one of the better ones (#4 Dow, #6 S&P). It is very possible that we see a bounce into the end of the quarter, and beginning of the next quarter. With that, volatility could come in a bit. The summer is typically a lower volatility season, and we will go into that tomorrow.
In the meantime, I picked up July VXX puts at $18 for .14 and $19 for .31. When the market bounces, I will let these go. I think a reasonable target for the $19’s is .50, and at that point I can reevaluate how to handle the $18’s. The $18’s were .60 only a few days to go and have four weeks until expiration.
I also started a SPY calendar at 157, selling this week against July 19th for 1.40. If the SPY closes at or below 157 this week, those are great runners for a bounce.