Now you know why June is the 2nd worst month for the Dow. By the way, sell in May was entirely accurate. How many pundits said that sell in May didn’t work this year. It did in fact work to perfection. The biggest key to selling in May this year was when you sold. It doesn’t have to be on April 30th. But even if you did, the S&P fell below that level today.
Volatility is at the highs of the year. On December 28th, it was roughly 22, and before that you have to go back to June of last year to see a higher VIX. The 50 day moving average was broken like it didn’t exist, and as the day wore on puts were in very high demand. Take a look at this chart:
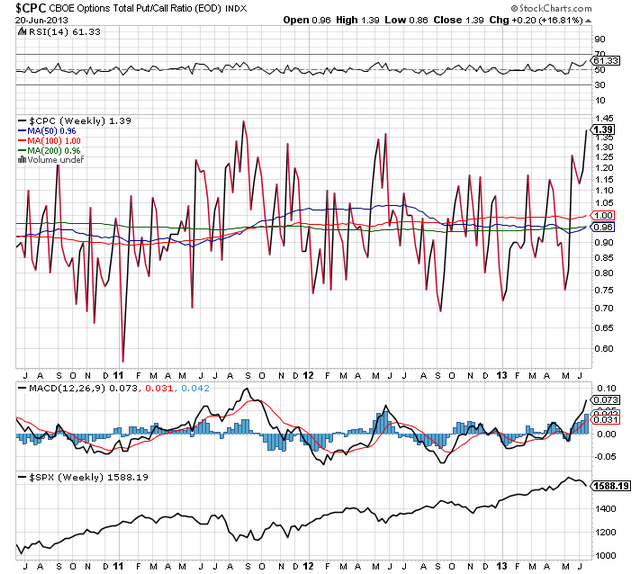
Clearly, this is an extreme level and generally coincides with the lows in the S&P. This is where you buy VXX puts. IMO, it does not get much easier. Sure we could have 5% or more to the downside, but at this rate, that will be here by Monday. Â I legged into July 5th $22 puts for an average of 1.22. If the market opens lower, and the VXX is higher, I will add, potentially farther out in time.
The futures are slightly backwardated and many traders believe that this means more downside for the S&P, although this happened recently and it reversed itself in very short order. Spot VIX is higher than July as well.
| Symbol | Contract | Month | Time | Last | Change | Open | High | Low |
|---|---|---|---|---|---|---|---|---|
| VX N3-CF | S&P 500 VOLATILITY | July2013 | 16:41:18 | 19.65 | 2.04 | 18.05 | 20.25 | 18.00 |
| VX Q3-CF | S&P 500 VOLATILITY | August2013 | 16:41:18 | 19.45 | 1.08 | 18.70 | 20.35 | 18.60 |
| VX U3-CF | S&P 500 VOLATILITY | September2013 | 16:41:19 | 20.05 | 0.98 | 19.30 | 20.65 | 19.20 |
The VXX puts are better than buying index options, because the market does not need to move much higher for volatility to come out. That being said, the VIX is higher than July futures, so the VXX will probably not fall as fast.
Riskier but potentially more profitable trades can be made in next week’s puts. Frequently the first week of the opex cycle shows the lowest volatility and is when the VXX gets hit hard. But, keep in mind that spot is higher than the futures, so the VXX can certainly go higher from here.