If you are a believer in efficient market theory, you have a tough time defending that fantasy this year, and especially this month. Like clockwork for the second time in two weeks, the S&P rode the 10 day moving average right to the 50 day, and bounced off of it like every beginner technical analyst draws it up. It is amazing to watch frankly. The clue yesterday was the low volume drift to the 50, as if it had no real intention to break it, just to tag it.
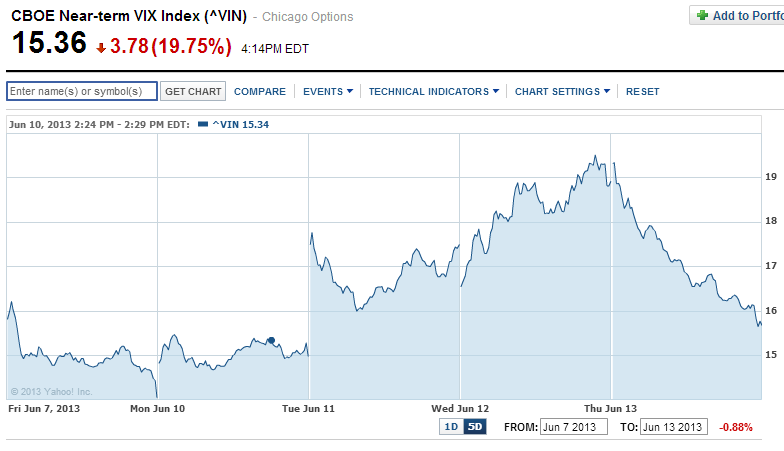
Volatility in the near month (VIN is the ticker for CBOE near month vol) fell an eye-popping 20%:
Since the VIX is comprised of rolling near and next month vol, the VIX only fell 12%. After Friday’s close, the VIX will roll to July and August options, one week ahead of options expiraton. This is to diminish the effect of expiration volatility. Little do they realize that the most volatile days in the option cycle statistically occur the week before options expiration. And the end of the expiration cycle is typically low volatility, which of course runs counter to the nonsense you hear on TV about witching and all that blather.
Keep in mind that on Monday, the VIX will be July and a negative portion of August. The formula will be July x 1.25 – .25 August. This effect pulls spot VIX down frequently during that part of the cycle. Virtually no one knows about this effect, certainly it seems no one on CNBC has ever read about how the VIX is constructed. They are just amazed at how it magically falls for no reason.
The futures are now holding a premium to spot VIX, and in July it is a large premium, which will be the front month in 3 trading days. And that sets up the VXX for lower prices if the Fed meeting is a non-event. From what Bernanke has said over and over again, it’s pretty obvious that it will. Who knows what imaginary meaning the pundits at CNBC will devine from his plainspeak.
| VX M3-CF | S&P 500 VOLATILITY | June2013 | 16:15:00 | 16.75 | -1.50 | 18.45 | 18.45 | 16.65 |
| VX N3-CF | S&P 500 VOLATILITY | July2013 | 16:21:33 | 17.70 | -0.85 | 18.70 | 18.71 | 17.60 |
| VX Q3-CF | S&P 500 VOLATILITY | August2013 | 16:15:00 | 18.40 | -0.40 | 18.95 | 19.00 | 18.17 |
VIX Volatility Index values generated at:Â Â 06/13/2013 15:12:43
| Trade Date | Expiration Date | VIX | Contract Month |
| 6/13/2013 3:12:43 PM | 15.41 | 1 | |
| 6/13/2013 3:12:43 PM | 16.48 | 2 | |
| 6/13/2013 3:12:43 PM | 17.13 | 3 | |
| 6/13/2013 3:12:43 PM | 17.92 | 4 | |
| 6/13/2013 3:12:43 PM | 19.17 | 5 | |
So if you were holding June index puts today, they evaporated into thin air. As far as the VXX goes, it could easily see sub 19 in three or four days. This is of course provided the market takes the Fed meeting well. A $1 drop in July VIX futures will send the VXX to $19. That is a reasonable target. The VXX puts are not cheap for next week, so a better strategy may be to butterfly around $19 to get your leverage at very low risk. These puts were very active today.
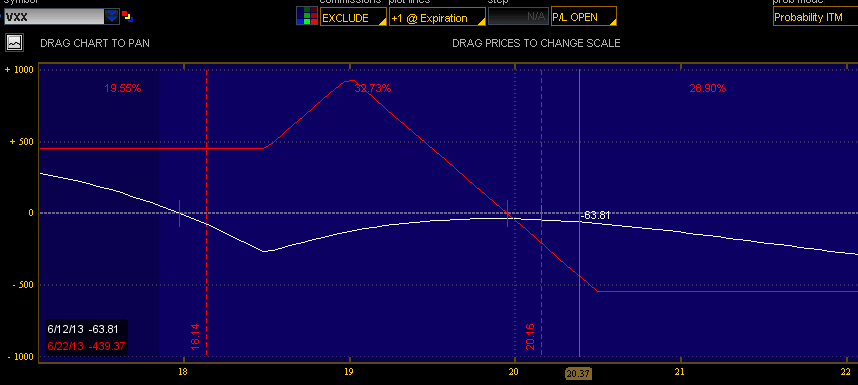
Here is an example of how you could put this together:
Next weeks VXX expiration:
buy 1 $18.5 call for $1.70
sell 2 $19 calls for $1.40 = $2.80
buy 1 $20.5 call for $.65
Total credit of $.45
Here is what it looks like:
It has a roughly 2-1 risk/reward payoff, and realistically the risk is lower than what is graphically represented. With the VXX June puts at $19.5 trading for nearly .50, you wouldn’t even make money if the VXX fell to 19. Here you have the odds working for you. You could tighten the butterfly up to 18.5/19/19.5 and pay almost nothing, but then you would need to virtually nail 19 on the dot to make it work.
I sold more SPY diagonals today at 164.5/165 June/June4 for .10. These diagonals have been absolutely marvelous in what essentially has been a sideways market since May 31. They provide an asymmetric risk/reward profile.
If you can believe it, if June ended today, it would be an up month for the S&P, the eighth in a row.

