We are back in those days again, when weak speculation on the basis of absolutely nothing by nobodies near a news wire can evaporate 15 S&P points in a half hour. Tape bombing by “reporters”, to either make a name for themselves, or to get paid by HFT news algorithms is a fact of today’s market life, especially when low volume allows these tactics to have the greatest effect. Amazing how journalists used to get facts and sources, now they say whatever they want. This is not limited to financial journalists, as recent episodes on CNN make it clear that facts are a secondary requirement of news.
Anyway, the VIX while fresh into its new near and next month structure, (July and August) currently sits at a value below both months, as the VIN and VIF are higher than the VIX. Sixfigureinvesting.com does a fantastic job explaining the nuances of this part of the opex cycle, and how it affects the VIX:
http://sixfigureinvesting.com/2013/05/calculating-vix-the-easy-part/
“The chart below shows the calculation on the next trading day when VIN switches to June options and VIF uses July options. Â Notice how the green VIX bar is now to the left of the blue VIN bar.”
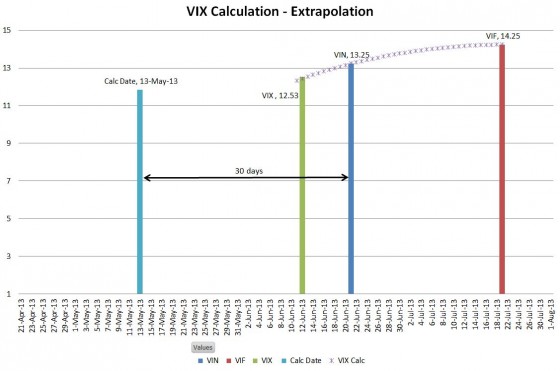
(It may have been implied by my last post that you can take the number of days and arrive at a VIX calculation weighting the August days as a negative weighting for this week and the July days at a premium using the time remaining in the respective cycle for each, but this is not the case. I won’t get into the hard specifics of variance vs. standard deviation and their effects on the VIX formula vis a vis the time factor, but Vance does this with terrific clarity in his post, referenced above. Suffice it to say that you can roughly ballpark it just knowing the VIN, VIF and where you are in the opex cycle.)
The old “volatility is here to stay” nonsense is back, and if there is one thing we know for sure, it is that it is not, because it never is. It costs money to drive up implied volatility, and it won’t happen forever. The last time it was here to stay was in December during the stand-off in D.C., and it promptly disappeared as fast as Alaska snow in 90 degree weather. (http://www.accuweather.com/en/weather-news/heat-turns-up-in-alaska-1/14371788)
The VIX futures expire tomorrow, and the Wednesday open is alway interesting to watch due to the rumored shenanigans at settlement with the opening quotes. Â The VIX curve looks surprisingly normal, not far from historical patterns and upward sloping, so this volatility is not that out of the ordinary:
| Symbol | Contract | Month | Time | Last | Change | Open | High | Low |
|---|---|---|---|---|---|---|---|---|
| VX M3-CF | S&P 500 VOLATILITY | June2013 | 16:15:00 | 16.90 | -0.65 | 17.00 | 17.53 | 16.53 |
| VX N3-CF | S&P 500 VOLATILITY | July2013 | 16:15:00 | 17.80 | -0.50 | 17.90 | 18.19 | 17.65 |
| VX Q3-CF | S&P 500 VOLATILITY | August2013 | 16:15:00 | 18.55 | -0.35 | 18.50 | 18.75 | 18.31 |
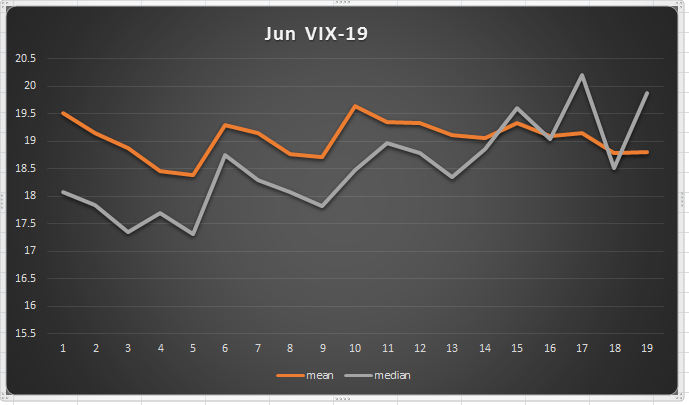
Realistically, June’s volatility is below the historical average. It is important to note that the sample size is relatively small, due to the VIX’s short life. Also the relative change/expansion in option volume over time should be considered when looking at historical data. Yet even considering the moves in stocks over the last few years, 10 day HV is only 16.5%:
http://www.ivolatility.com/options.j?period=12&chart=2&ticker=SPY%3ANYSEArca&R=1
In this choppy market, diagonal spreads are dynamite trades. Here are a couple examples that we closed today, after last week’s short option expired:
SPY June 14th/June 21st diagonal call
Short $164 June 14th
Long $165 June 21st
Net debit .07, closed today for .87- 1143% return on cost. Since the net exposure was technically $1, then you could claim that the 4 day return was 87% based on theoretical total exposure/margin. But the odds of that entire $1 being at risk is very low.
Same structure for the IWM:
Short June 14th $99 call
Long June 21st $100 call
Net credit of .01, return of .34. The 98/99 spread incurred a .08 debit for a .50 return.
The beauty of these trades is that exposure is minimized, while the return could be in the stratosphere as you get a free runner after the short leg is closed or expires worthless. If I held these through today, it is possible that .87 could have turned into 1.50 or so, but who is going to be that greedy on a .07 debit when the risk is now not .07 but .87?
I put this on again today, near the highs. I just couldn’t see the S&P going higher than 20 points in front of the FED, and volume was light. Furthermore, the consensus is already talking about buying the FED meeting, so it wouldn’t surprise me one bit to see the market rise tomorrow and early Wednesday just to see it reverse.
Today’s trade:
Short SPY June 21st 165 call for $1.02
Long SPY June 28th 166 call for .95
Net credit .07. Here is how it looks:

Perfection is for the SPY to hover around 165 on Friday, then you get a free look at the long side for a couple days the following week. But if we get a rally to 1665 or so, it is not going to do any significant damage. You just close it for a few cents and come back next week. This chart does not do the trade justice, because there are two separate paths, closing/expiration of the short put to allow theoretical unlimited profits, and closing both legs by Friday. The charting does not show path-dependent risk/reward scenarios.
The odds of cashing on this trade are very high and asymmetric to your risk. I also put on the IWM at 99/100 in the same fashion for a .01 credit. The IWM would have to make an all-time high by Friday to cause any issues on that trade. I like those odds.