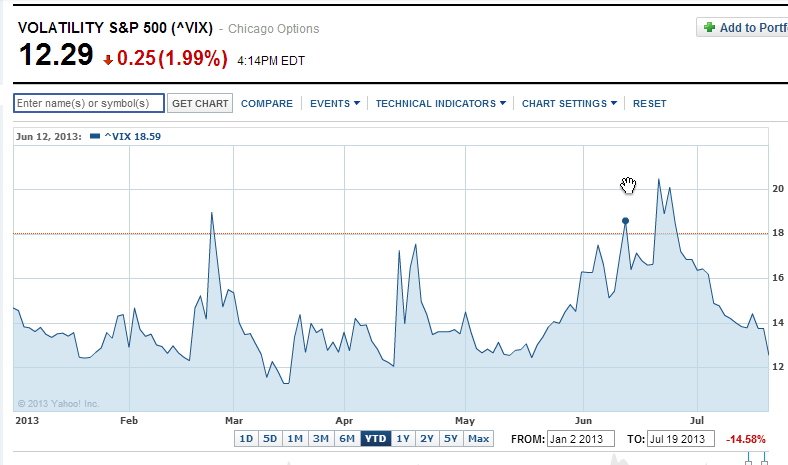
The end of the OPEX cycle and the beginning of the following one frequently demonstrate the lowest levels of volatility for the cycle. As the market has moved completely unabated to higher levels, the VIX has receded to levels reminiscent of the mid 2000’s. It has only spent 3 days below 12 in 2013, and these levels have preceded significantly higher volatility. I suppose that the summer could see a continuous run higher in the S&P every single day, but the odds would be against that.
On April 15th, the VIX rose from 12.06 to 17.27. While I certainly am not suggesting that will happen, one must be aware of the possibilities when the VIX is this low. Because this level of volatility generally precedes higher vol and not more of the same, it behooves one to look for ways to anticipate what most folks are not right now. One month ago, volatility was “here to stay”, and it was obvious that it was not. Now low vol is expected by the punditry with no hiccups in the market until September, because their memory is about a week long, unless the pundit is a perma-bear expecting the next trip to S&P 666.
The futures:
| VX Q3-CF | S&P 500 VOLATILITY | August2013 | 16:12:19 | 14.70 | -0.20 | 13.95 | 15.12 | 14.65 |
| VX U3-CF | S&P 500 VOLATILITY | September2013 | 16:10:15 | 16.15 | -0.35 | 16.45 | 16.55 | 16.10 |
| VX V3-CF | S&P 500 VOLATILITY | October2013 | 16:12:19 | 17.25 | -0.30 | 17.45 | 17.60 | 17.15 |
The spread of August to spot VIX is over two, but keep in mind that the VIX futures have an extra week this month, expiring on August 20th, after OPEX. This will hold up that front month premium a bit longer. But it must be noted, that the VXX holds 85% of the front month right now, so if there is action in the marketplace, the VXX can move quickly, without the next month’s extra premium to buffer the rise in the VIX.
I expected a flat to higher VXX over the next OPEX cycle, and that there could be volatility as early as this week. There are no signs of that yet, but if July contains no downside volatility, the S&P will register the largest monthly advance since a 10% bounce in October of 2011 following the debt debacle crash. So in essence, this would be the largest monthly gain in the S&P 500 since 2010 that didn’t follow a major correction. So instead of sending me emails about how I have been wrong for the past whole 3 days, look at this chart and make some of your own assessments:
VIX Volatility Index values generated at:Â Â 07/22/2013 14:58:02
| Trade Date | Expiration Date | VIX | Contract Month |
| 7/22/2013 2:58:02 PM | 11.96 | 1 | |
| 7/22/2013 2:58:02 PM | 13.57 | 2 | |
| 7/22/2013 2:58:02 PM | 14.59 | 3 |
The VIX term structure is very low, considering the history of the market in September and October. At the money September SPY puts can be purchased for 2.2% of the current index price. Some very attractive spreads can be constructed at these prices.
Oil reversed and closed lower than the prior day’s low on unchanged volatility. That is very interesting, considering this was the first time since June 21st that this occurred. The put/call ratio was 2 to 1 in the USO, the basis for the OVX, or the oil VIX. The implied vol sits in the bottom third of its 52 week IV percentile, and that is at these lofty levels. I continue to believe that the puts on the USO and UCO remain bargain priced right here. Long UCO $34, $33, and $31 August puts.
I also initiated a long SPY put spread, August 2nd $169/167 for .57. Could return nearly 4-1 if the SPY closes below 167 on August 2nd. Nice asymmetric risk/reward set-up. I do not own any VXX calls (I almost never do), but am eyeing call spreads. I firmly believe that selling call spreads and buying puts when the VIX is high is the easiest way to play the VXX, but occasionally call spreads can present higher probability 2.5-1 risk/reward ratios. One example may be the Aug 2nd $15/15.5 for around .20.
