Another day, another buy of the dip. Which make me wonder this: While ignorant pundits chastise the VIX for being dysfunctional now that we are in a bull market (not the case folks), what does the NYMO, or McClellan oscillator do for anyone? How can a market be oversold when it is a couple S&P points off all-time highs?
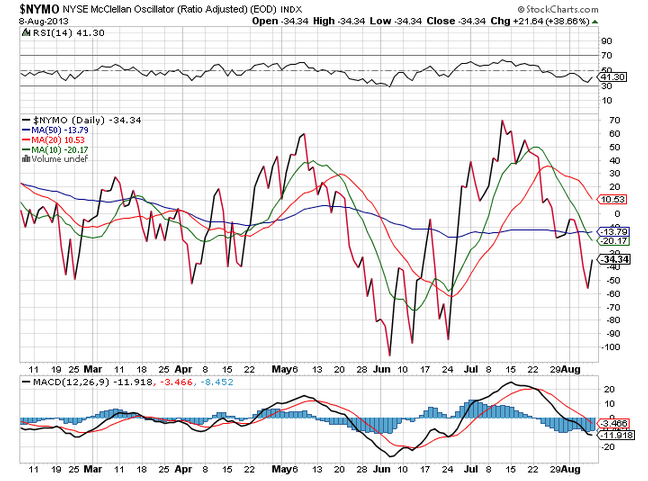
A reading, like yesterday’s reading of -60 is supposedly an oversold market in the short-term that has a higher probability of going higher due to recent selling pressure. This selling pressure is determined to be a more recent moving average of declining stocks relative to advancing stocks below a longer-term average (19ema vs 39ema). But here is what bothers me about this indicator:
What if the futures for a few days just open the market lower and the investors buy the dip and the market finishes slightly lower. That is not selling pressure at all. It is just the futures market playing games with opening market maker bids. In fact, this week has seen lower opens and consistent buying. In my mind, the market may be overbought in the short term, far more than people expect. This is not a conjecture on whether the market is going lower, just a request for commentary on this oscillator.
Back to the VIX. Because starting in a week or so, the structure of the VIX will become September and October, the days of 11-12 reading are quickly coming to an end. Recall the term structure of the VIX:
VIX Volatility Index values generated at:Â Â 08/08/2013 15:14:52
| Trade Date | Expiration Date | VIX | Contract Month |
| 8/8/2013 3:14:52 PM | 11.30 | 1 | |
| 8/8/2013 3:14:52 PM | 12.87 | 2 | |
| 8/8/2013 3:14:52 PM | 13.97 | 3 | |
| 8/8/2013 3:14:52 PM | 14.80 | 4 | |
| 8/8/2013 3:14:52 PM | 15.68 | 5 | |
| 8/8/2013 3:14:52 PM | 16.02 | 6 | |
| 8/8/2013 3:14:52 PM | 16.97 | 7 | |
| 8/8/2013 3:14:52 PM | 18.23 | 8 | |
| 8/8/2013 3:14:52 PM | 19.99 | 9 | |
| 8/8/2013 3:14:52 PM | 19.51 | 10 |
This is what the options market is saying about future price movements, and while these numbers look low, a touch of implied volatility can change that in a day. The futures say something different:
| Symbol | Contract | Month | Time | Last | Change | Open | High | Low |
|---|---|---|---|---|---|---|---|---|
| VX Q3-CF | S&P 500 VOLATILITY | August2013 | 16:40:16 | 13.25 | -0.30 | 13.30 | 13.65 | 13.20 |
| VX U3-CF | S&P 500 VOLATILITY | September2013 | 16:40:16 | 14.85 | -0.20 | 14.85 | 15.10 | 14.70 |
| VX V3-CF | S&P 500 VOLATILITY | October2013 | 16:40:16 | 15.90 | -0.15 | 15.85 | 16.10 | 15.70 |
They are predicting more volatility in Sep and Oct, but even they are behind the curve. (pardon the pun) What causes the difference between the futures and the actual prices of the S&P options? The options market has basically called off volatility for August, thus the implied vol in the options is low relative the the amount of time to expiration. They basically have burnt off a ton of time decay already.
Yet the VIX will be rolling into October in 10 days. While it is not purely linear on a daily basis, it will put a solid floor in the VIX, and probably not long after OPEX on Aug 17th. So be ready to implement our Sep VIX $12 call trade from yesterday’s post whenever you see it in the $2.60 area, as these times will be fleeting.
Lastly, the 3x ETF’s have created vol selling opportunities in low vol environments. These options are heavily traded and as I have mentioned before, are used by a lot of folks looking to hedge, instead of wasting money on overpriced VIX OTM calls. Butterflies in the TNA and FAS offer nice 4-6/1 risk/rewards. Here was the trade we proposed a week or so back:
Long FAS $71 Aug 17
Short 2 FAS $74
Long FAS $77
This was for a net debit of .60 with a potential return of $3! In a flat market, this is a no-brainer. Your max risk is the .60 and all you need is to get within roughly 75% of this range, $71-77, to make money on the trade. With a week to go the FAS is at 73.60 or so and it has already made 60%. Another advantage: if it’s working you can close it early.
The VXX is clearly in no man’s land with a heavy roll and no premium to sell in spreads or calendars. Buying puts on vol bumps worked again today, for like the 10th time in a row. Not time to get long in any way yet.