These are the times you should look forward to. People are starting to spend serious money on out of the money puts and pumping up the VIX. The low delta puts are catching a strong bid, and this is what gets the VIX surging. It has been a while since we’ve seen this, and it could go much higher. First, let’s look at the VIX weekly chart to get some perspective:
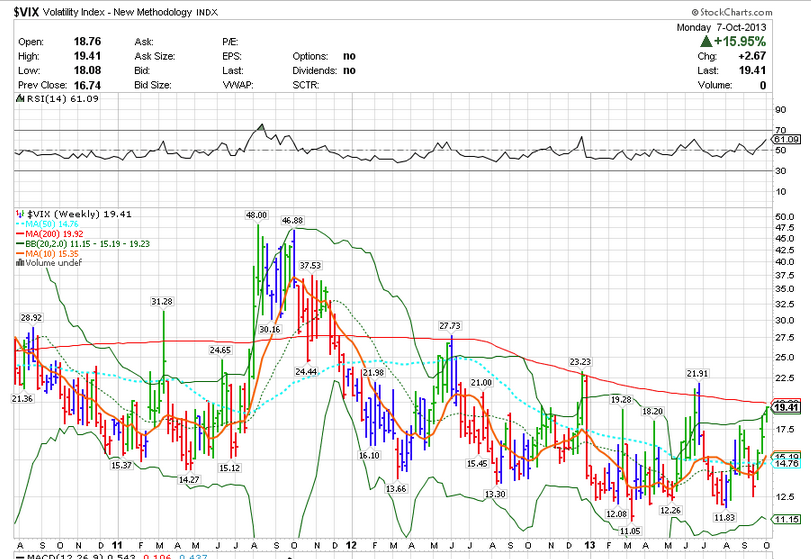
Realistically, we are not that high, in fact we are about average for an October VIX. Looking at past mini-crises in recent years, the VIX has been much higher. The last debt ceiling debacle saw a VIX of nearly 50. As recently as last December it was 23. So 19 is not that high, and this chart demonstrates that.
We have not had a real correction for over two years, so there are a lot of folks out there that have had nothing to fear for a long time. Add to that the consensus opinion that the government will come to a deal on Oct. 17th, and you have a recipe for a surprise. I’m not expecting a cataclysmic event either, but you must keep in mind what could go wrong.
This demonstrates how heavily bid the OTM puts were. Look at the low deltas as a percentage of put purchases on the SPY:

When the spot VIX and futures are in backwardation, the curve inverts and it is a cause to be wary. If you are short VIX futures for Oct, you should be sweating because the Oct future will get closer to spot as we approach the 15th, and that could be the height of concern:
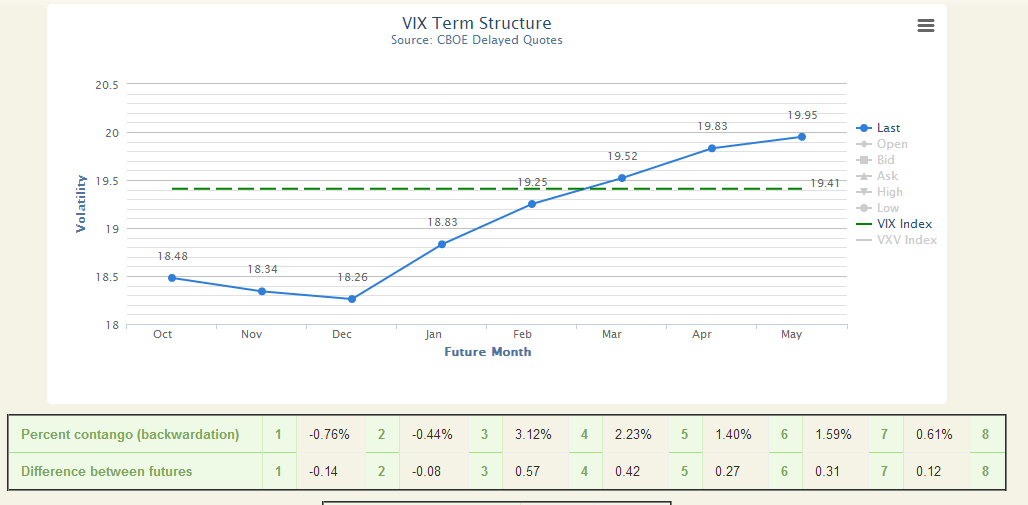
Courtesy: Vixcentral.com
This structure means that the VXX and UVXY are adding value as they roll into November, by purchasing cheaper futures (NOV) and selling more expensive ones (OCT). This is positive roll and for the VXX and UVXY it is rare. But this situation can certainly imply more equity market pain.
I’m getting itchy to sell vol, but it is not the time, because we are nowhere near a resolution, and a lot of index charts are implying more downside. The S&P broke the 50 SMA today, and the Russell 2k just gave a MACD cross lower sell signal. I’m literally sitting on my hands right here, but should there be a break in the logjam (doubtful this week, IMO), then I will be ready to act.