This has been an interesting year in volatility. The past few years have rewarded the most simple of vol strategies, selling vol into U.S. political events and over-hyped European debt crises. (See Cyprus, Portugal, Greece. Greece just came to the bond market last week, and it was SEVEN times oversubscribed at a yield of 4.95%. Apparently their “junk” rating is junk:Â http://www.bloomberg.com/news/2014-04-22/samaras-sees-greek-bond-yields-falling-more.html)
But now, just as then, a simple strategy can be almost as profitable as long as you exercise patience and know your math in the volatility ETN’s.
Volatility that remains in a firm low range for long periods is not rare, although folks on television frequently harp about the VIX being broken. But let’s be frank, a lot of the CNBC folks do almost zero homework and regurgitate what they hear among each other as fact. The Russell 2k VIX (RVX) and the Nasdaq VIX (VXN) both exceeded 20 recently, a fact you would never hear on CNBC. That is where the volatility was, and the implied volatilities of those indexes reflected that risk.
Russell 2k, Nasdaq 100, and S&P 500 VIXs:
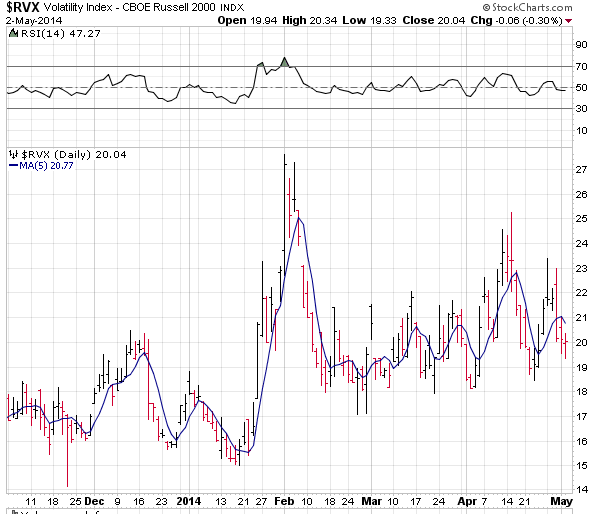
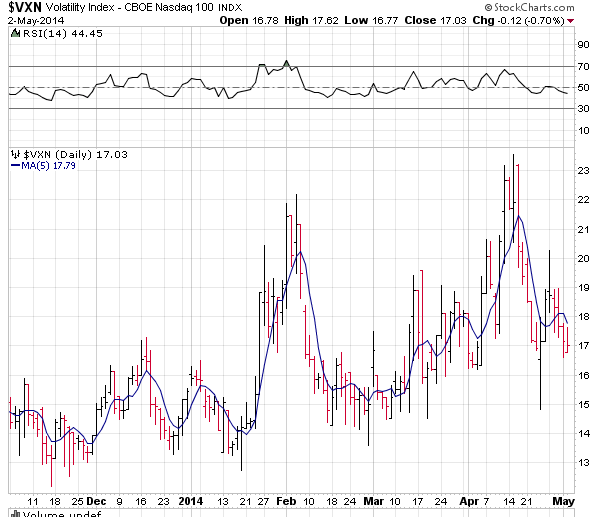

Unfortunately for vol traders/hedgers, Nasdaq VIX and Russell 2000 VIX options were a flop. That also appears to be the case with the VXST, the short-term S&P 500 VIX options. There has yet to be any significant volume in that recently released product. Fact is there are plenty of weekly options available these days in the ETF world for hedging/trading. But, the CBOE does a terrible job of educating anyone in the media about how the VIX works, and therefore no interest or knowledge flows into what could be very useful option products in the VXN and RVX. Especially this year, as you can see in the above charts that the Nasdaq and Russell indexes have entered higher vol ranges.
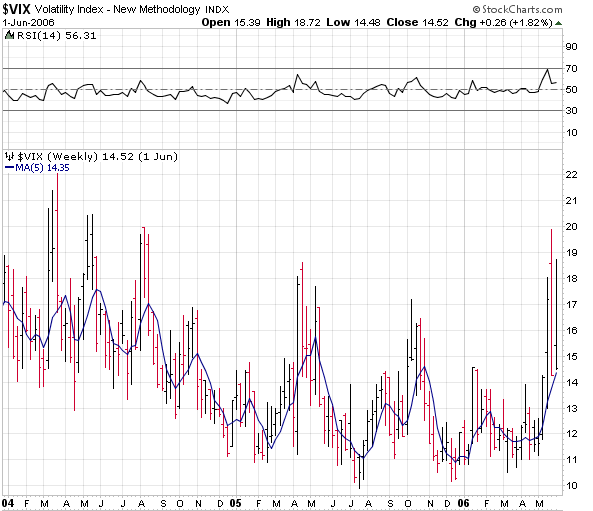
Anyway, back to plain old S&P VIX, let’s look at a period of time when the VIX held a similar tight range below 18:
Jan 2004 to June 2006:
And 2012 to today:
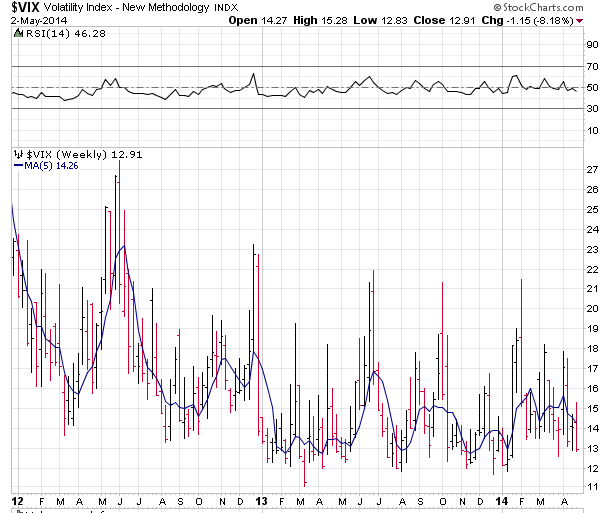
These are weekly VIX charts covering the same length of time. Not only that, these two charts cover the same time in the presidential cycle, ending in the mid-term election year. They are incredibly similar. In 2004-6, the internet bubble was fading into the distance, and here we are trying to forget about the mortgage crisis.
So vol never goes away, but it hibernates for weeks just to reappear again, albeit in a lower range. So if you have weeks of VIX in the 12-14 range, what can you do? Sell VXX and UVXY put spreads.
First you need to calculate the negative roll in the futures term structure. Here at vixcentral.com, he does it for you:
Courtesy vixcentral.com

So in the VXX’s case, the calculation is roughly:
.0638 (contango given in the above chart) / 25 (days in this vix roll cycle) x $40 (VXX price) = 10 cents per day of negative roll. This is what the VXX loses on a daily basis at this current structure while rolling from May to June on a daily basis. Now you know what you can roughly expect the VXX to lose over time provided this structure persists. It allows you to project how far the VXX could fall.
Now you need to know how much the VXX is holding of each future, May and June:
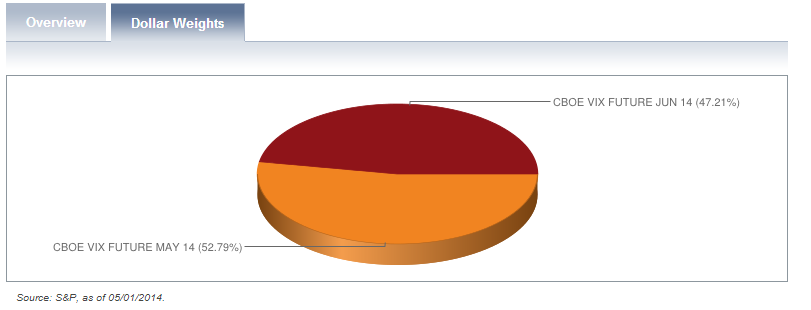
Almost 50% of each. This is important because the more expensive June future will not rise or fall as fast as the front month. So, if the VXX is heavily back-loaded or front-loaded with a majority of one option, it is far more susceptible to big moves up or down. So right now, it is sort of sluggish, it does not want to move at the same speed as spot VIX. You need to know this, because generally this product moves quickest at the beginning and end of VIX cycles.
Ok, we’ve laid the groundwork for the trades. Next post this weekend I will show some option chains and build some trade structures.