Oddly enough, today the almost traditional dip buying failed to materialize, and in fact the S&P finished at the lows of the day. Regardless of how oversold the McClellan Oscillator says the market is, the relentless dip buying can take its toll eventually, exhausting buying power and creating real dips. Interestingly, the Dow is filling the gap from July 11th, when the market gapped higher simply because Bernanke mentioned in a Q&A session that he would do what he has always said: follow the two mandates of the FED, jobs and inflation. The S&P is nowhere near filling that gap at 1650-1670 from that date.
See the gap magnet on the left side of the chart:

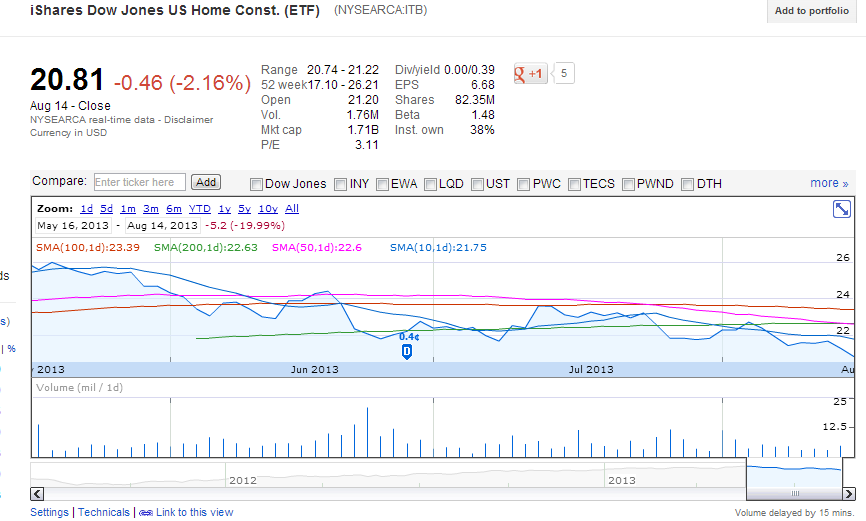
The bearish signals are getting even bearisher, and if it weren’t for tech (re:aapl) and materials (XLB, GLD) the S&P would have rolled over and laid a solid egg by now. The trannies (IYT) and other sectors are nearing 50 day support, while the homebuilders are literally entering a bear market of -20% from the highs:
The VIX made a modest move higher to 13 (6% is modest off a 12 VIX), and it nudged the futures a bit, but certainly didn’t shake them up. We stressed lately that the VIX has little room to fall, considering the VIX structure, which now looks like this:
VIX Volatility Index values generated at:Â Â 08/14/2013 15:14:52
| Trade Date | Expiration Date | VIX | Contract Month |
| 8/14/2013 3:14:52 PM | 13.53 | 1 | |
| 8/14/2013 3:14:52 PM | 14.44 | 2 | |
| 8/14/2013 3:14:52 PM | 15.23 | 3 | |
| 8/14/2013 3:14:52 PM | 16.15 | 4 |
The VIX is now rolling into October, and you should expect these values to hang tough for a while, with so much looming in the fall. The VIX is assigning a negative coefficient to October, as this is OPEX week and August vol is out of the equation. Thus, the VIX will have even more support from here every day it rolls. Furthermore, the VIX futures are in the same boat, not going more than 1 or 2% lower, regardless of the VIX:
| Symbol | Contract | Month | Time | Last | Change | Open | High | Low |
|---|---|---|---|---|---|---|---|---|
| VX Q3-CF | S&P 500 VOLATILITY | August2013 | 16:37:33 | 13.35 | 0.25 | 13.10 | 13.35 | 12.97 |
| VX U3-CF | S&P 500 VOLATILITY | September2013 | 16:37:33 | 15.15 | 0.25 | 14.90 | 15.15 | 14.70 |
| VX V3-CF | S&P 500 VOLATILITY | October2013 | 16:37:33 | 16.35 | 0.20 | 16.13 | 16.40 | 15.9 |
What is interesting, is that the implied vols for the indexes are backwards as the market falls! Look at the SPY IV’s for the next two weeks and tell me why this skew exists, as the markets roll over:

Is it pure disbelief or is it the constant bounce expectation factor? The traders almanac (a very well known publication on market history) shows the back end of this week and the middle of August as very bullish. People are conditioned for bounces, while at the same time crowing on and on about corrections, divergences, and tapering. Very odd combination, no?
Anyway, if there is a way to be long vol without dealing with roll pain, then dips in vol are to be bought. (not that spikes in vol can’t be sold, we are sort of in the silly season) The UVXY bull call spread is working to perfection. Keep in mind again, that getting naked long these products can be very hazardous to your margin account.