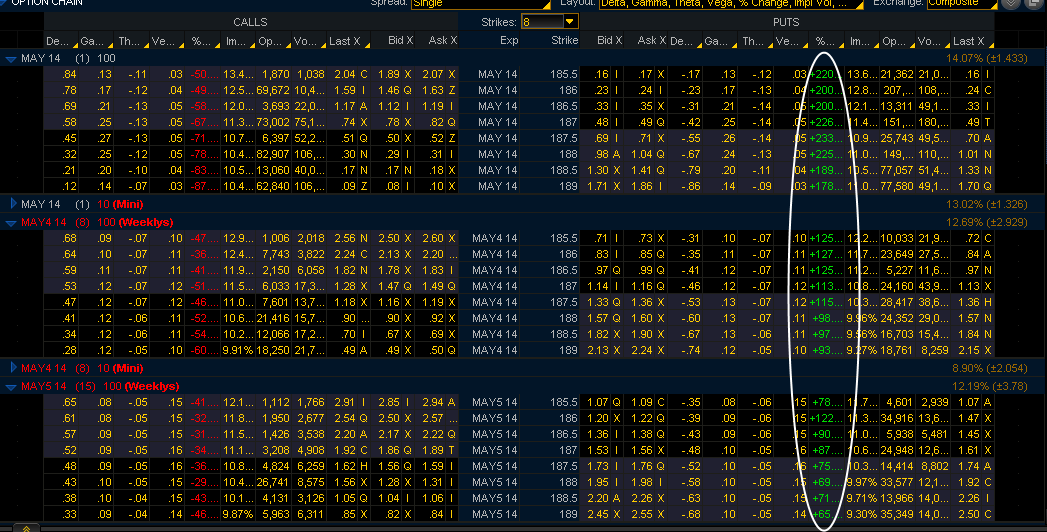
Today saw four month highs in the VIX, the S&P 500 gauge of implied volatility. Generally, sudden demand for puts and an absence of put sellers generates swift spikes up in the VIX, and today’s demand for puts was at a ratio of 2.6 to 1, with the largest percentage of puts being hit at the asking price.

The punditry is scrambling for an explanation, and Argentinian default is a reach at best. It appeared to me that the dip buyers finally dried up and gravity took over taking out the stops. In reality, today’s not that big of a deal after months of methodically plodding higher.
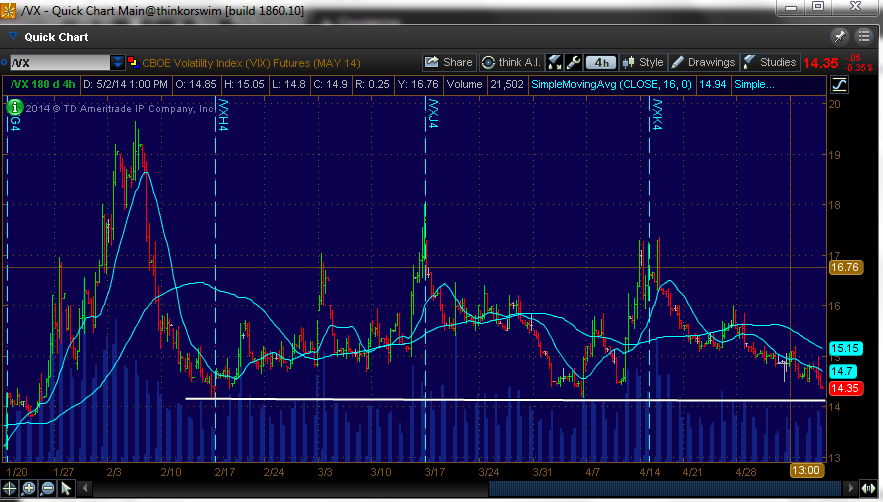
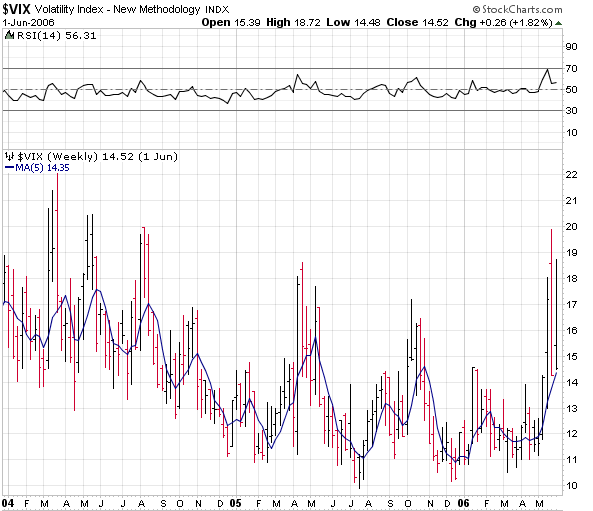
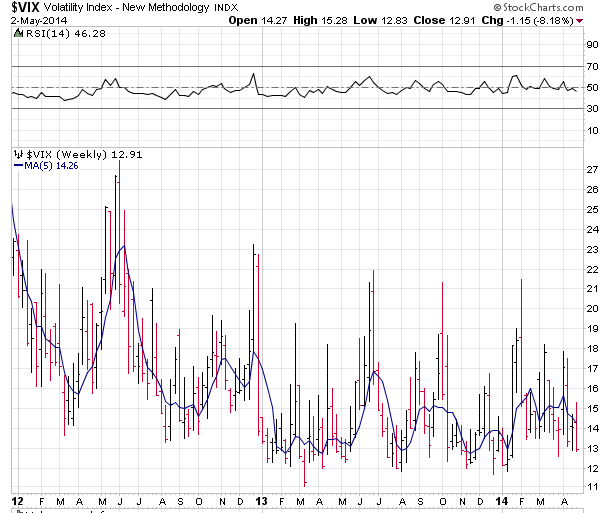
Let’s look at the VIX, VIX futures, and the VXX for immediate opportunities. First the VIX chart for 2014, demonstrating just how long it has been since the VIX has seen 17:
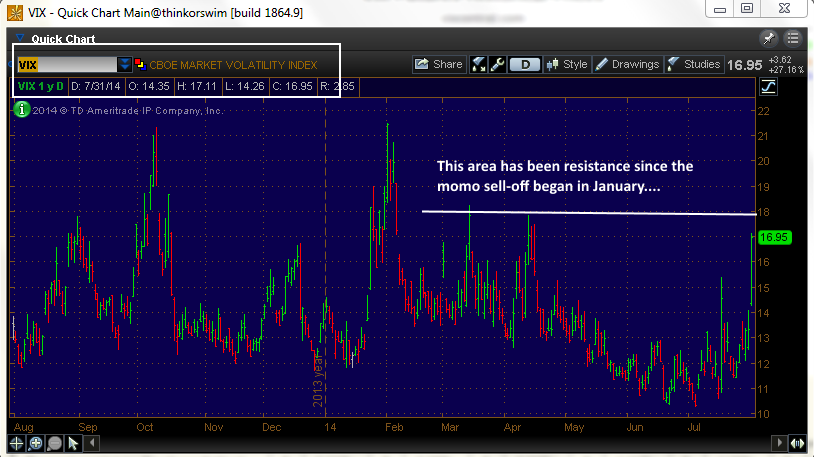
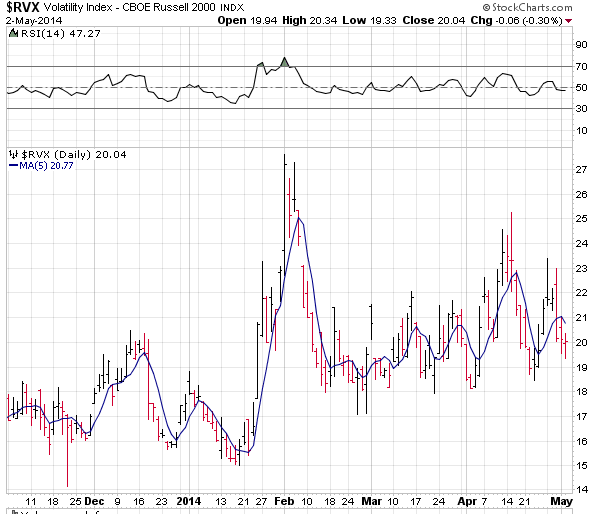
It certainly appears that the VIX is nearing resistance levels, but the VXST (9 day rolling VIX index) is significantly higher:

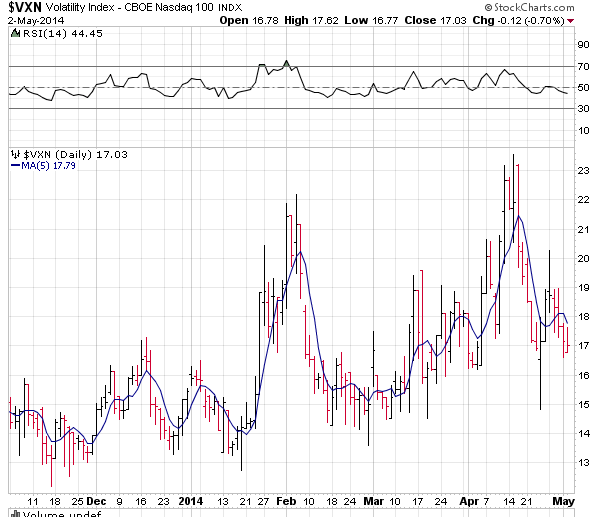
Meanwhile the VIX August future, which settles in a little under 3 weeks on August 20th, is not buying the move:
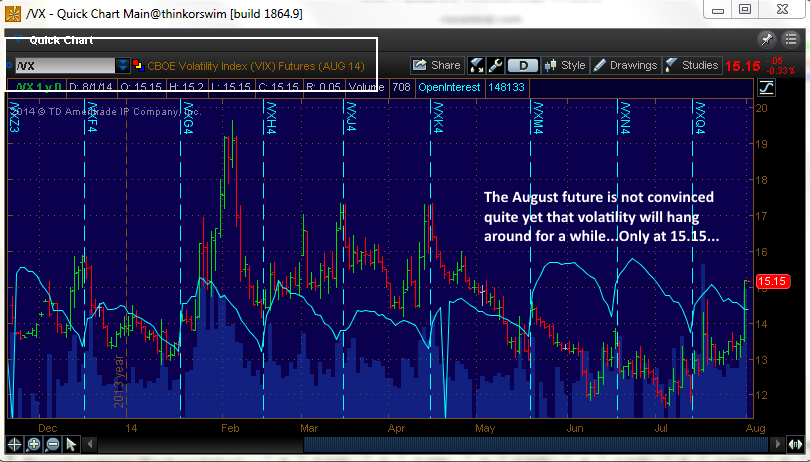
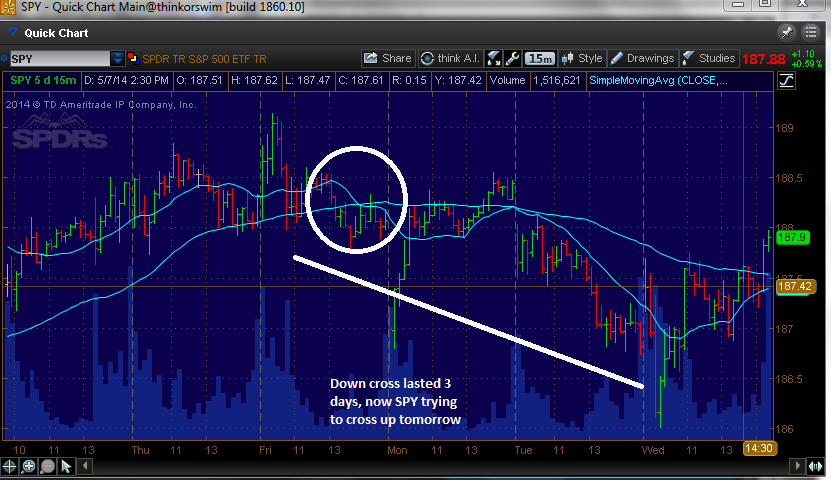
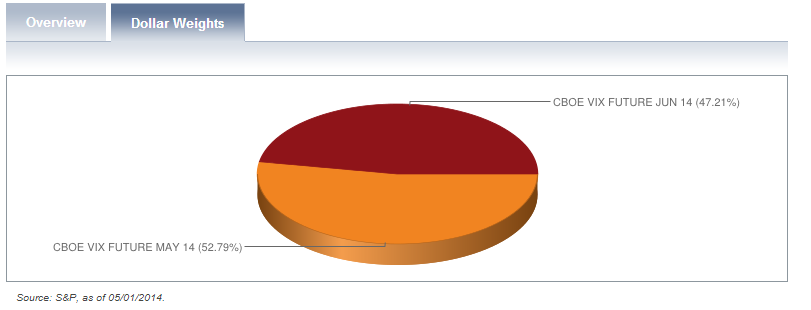
So you now have a backwardation from the VXST, to the VIX, to the VIX future. This means that S&P 500 implied volatility is highest in the nearest term. The translation of the shape of this curve is that investors are not looking for a prolonged sell-off. They are demanding weekly puts at a higher rate than they are looking for longer-term protection. Who can blame them? Every VIX spike has been a great volatility and premium selling opportunity, and put owners and short sellers have been burned over and over again. It is going to probably take a breach of the 100 day moving average on the SPX to get people thinking that something is really going on other than a buyable dip. Here is a look at the VIX futures term structure:
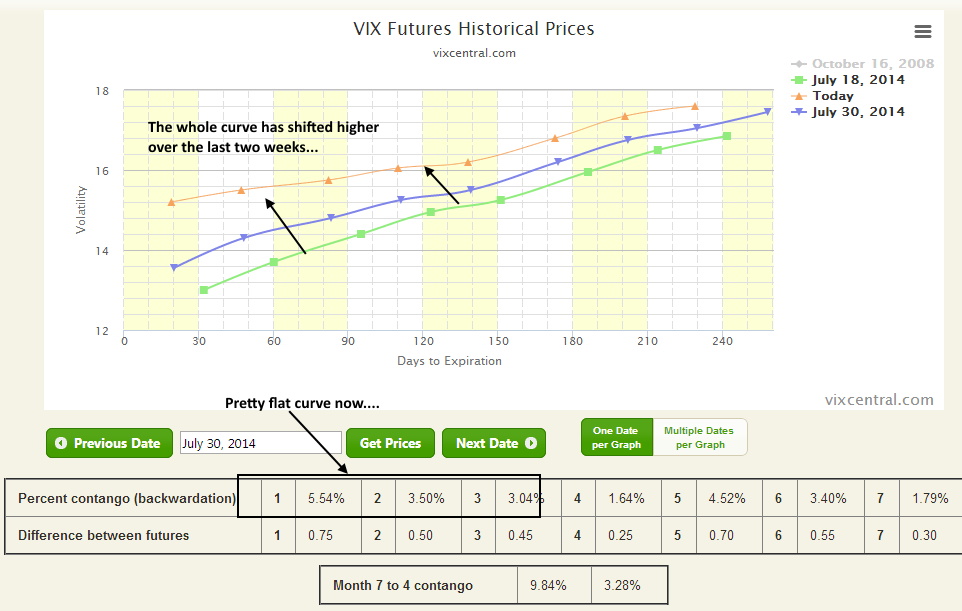
Courtesy Vixcentral.com
If you’re in the camp that this is just a temporary sell-off, then the VXX and UVXY offer some terrific ways to capitalize quickly on a fade in volatility, and I cover these every week in my subscriber newsletter. These ETFs can be tough to borrow to outright short, since the gig is up on these things as perennial value destroyers. I prefer to use the options as they are frequently mispriced, and that is exacerbated the farther out in time you go.
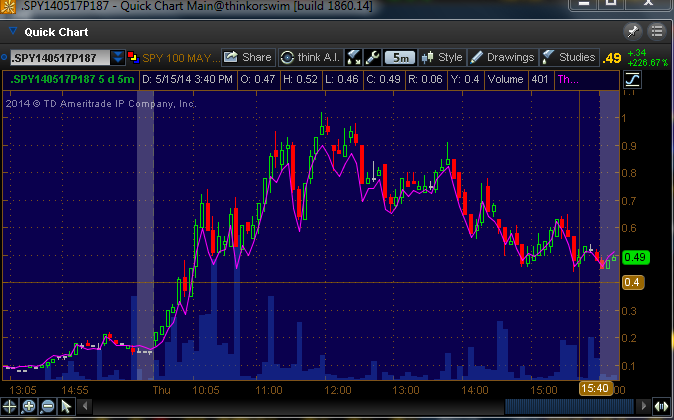
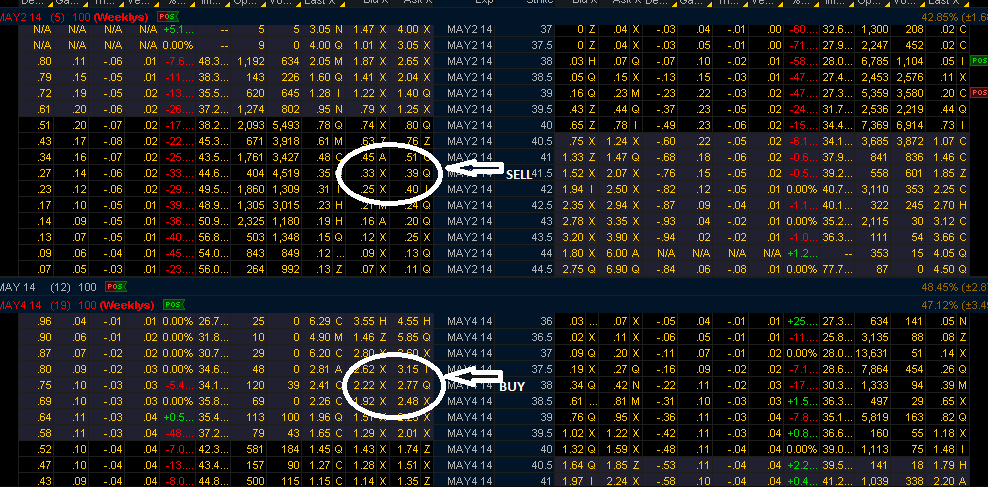
Today I sold the UVXY $50 September calls for $2.40-2.65. Take a look at the chart of this option:
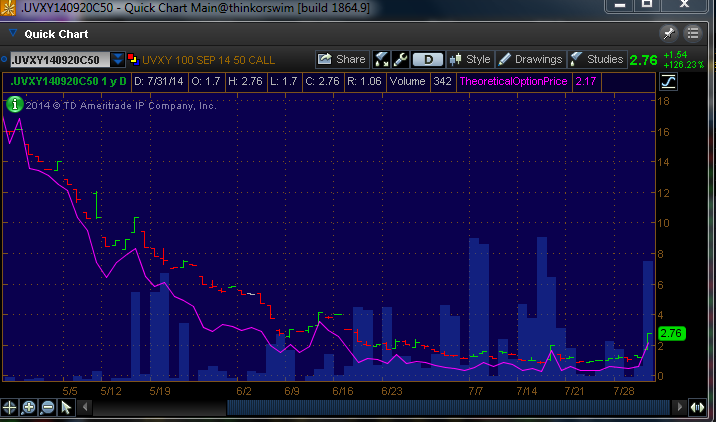
This option has fallen from $20 to $2.76 in 3 months, and it was only $1 yesterday. For this option to be in the money, the August and September VIX futures (the current UVXY holdings) would have to rise another 30% and remain there until the third week of September. The odds of that are quite slim as the September future would have to sit above 20. VIX futures have failed to sustain that price level for any significant amount of time since the spring of 2012.
You can take a longer-term approach by selling the VXX January $40 call. Again, you would need to see the effect of contango in the VXX disappear for stretches of time for that to happen, along with elevated futures prices. That option was up $1 today, so it wouldn’t be surprising to see that come back out of the price in a short period of time. Look even farther out to January of 2016 if you want to sell some calls and do very little position maintenance.
Of course, shorting these ETFs for the long haul will always work depending on your time frame. It’s only a matter of when, not if, the next reverse split arrives.

![2014-05-08 18_44_42-Main@thinkorswim [build 1860.10]](http://www.volatilityanalytics.com/wp-content/uploads/2014/05/2014-05-08-18_44_42-Main@thinkorswim-build-1860.10.png)
![2014-05-08 18_51_55-SPY - Quick Chart Main@thinkorswim [build 1860.10]](http://www.volatilityanalytics.com/wp-content/uploads/2014/05/2014-05-08-18_51_55-SPY-Quick-Chart-Main@thinkorswim-build-1860.10.png)
![2014-05-05 17_58_03-_VX - Quick Chart Main@thinkorswim [build 1860.10]](http://www.volatilityanalytics.com/wp-content/uploads/2014/05/2014-05-05-17_58_03-_VX-Quick-Chart-Main@thinkorswim-build-1860.10.png)
![2014-05-04 20_45_26-Main@thinkorswim [build 1860.10]](http://www.volatilityanalytics.com/wp-content/uploads/2014/05/2014-05-04-20_45_26-Main@thinkorswim-build-1860.10.png)


![2014-03-16 17_08_31-Main@thinkorswim [build 1856.11]](http://www.volatilityanalytics.com/wp-content/uploads/2014/03/2014-03-16-17_08_31-Main@thinkorswim-build-1856.11.png)
![2014-03-16 17_25_10-Main@thinkorswim [build 1856.11]](http://www.volatilityanalytics.com/wp-content/uploads/2014/03/2014-03-16-17_25_10-Main@thinkorswim-build-1856.11.png)

![2014-03-11 20_49_48-_VXJ4 - Quick Chart Main@thinkorswim [build 1856.8]](http://www.volatilityanalytics.com/wp-content/uploads/2014/03/2014-03-11-20_49_48-_VXJ4-Quick-Chart-Main@thinkorswim-build-1856.8.png)